In the case of complex modules, it is generally recommended that you create them in several steps and carry out an intermediate test after each step. This makes it easier to locate the source of any possible errors.
For modules with projections and histograms you have to note that projections and histograms must not be customized in the same data area. If you ignore this, a Python error message is displayed when the module is used.
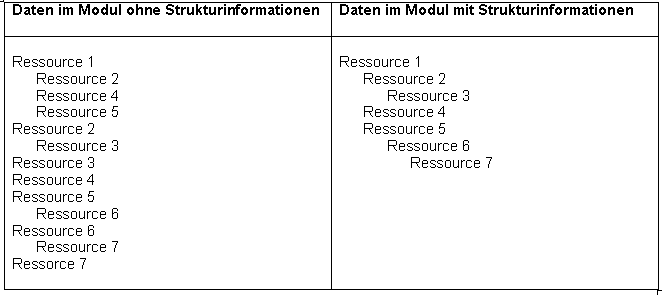
Module With Summarization
Objective
To summarize data from child data areas to a parent data area
Information
Depending on the DI type and the application logic, various different summarization types can be used.
There are some data fields for which summarization to a parent data area does not make sense. For alphanumeric data fields, it is of particular importance what use is made of a data field that is to be summarized, and how the data structure is set up.
Procedure
Data area
Assign the summarization data fields to the source area (area from which the data for summarization stem) and to the target area (area in which the summarized data is displayed).
Define the summarization type for the summarization data fields, e.g. 1 = sum.
Module
Define the target data area as a parent area of the source data area (directly or indirectly via the data area structure).
Notes
Modules in which summarization and projection are performed are constructed from the bottom up, because the source data stem from there and the origin of the data is therefore clearer.
Not all DI classes are suitable for summarization (e.g. OLE objects). It is, however, possible to summarize bars; in this case the associated start and end dates are presented in summary form.
When summarizing from a project structure to a grouped data area, e.g. a main project, summarization type = 2 must be set, because in the project structure only the value of the highest project, which in turn is a main project, is to be summarized.
When summarizing to the grouped data areas, you have to consider that this only makes sense for particular data structures.
Summarization between parallel data areas is not possible.
Modules with Projection
Information
Projection means the display of a (numeric) value at a particular date below a time scale.
It is only possible to project values that are associated with a date.
If the projected data is to be summarized additionally, include them in the target area and select the required value in the Summarization type field. Fill the Grid field in the target area as well.
Module
In the module construction, the area with the projection data fields must have a scale data area as parent area (directly or indirectly via the structure of the data areas).
Attention
It is not allowed to customize projections and histograms in the same data area. If you ignore this, a Python error message is output when the module is used.
Projected data items should be able to retrieve calculations from different sources.
Information
The calculations from the summarized data items can be made using value ranges. For this purpose, the required data items from different data areas are summarized in a target data area and calculated at this point. The data item to be calculated generally stems from the data table of the target area as well.
If the sources stem from another data table, which can be projected as well, calculation in the summarized areas is possible, but the result cannot be projected.
Example
Values from Load (DT472) and Period (DT468) are to be summarized to Resource (DT467), calculated there, and the calculated values are to be projected.
Module design:
Resource
Load
Period
Procedure
Projection DI
Has a D and a V sub-DI for each source
e.g. D Date from 472, V Value from 472, D Date from 468 and V Value from 468
The projected DI receives an additional value range, which defines the calculation of the sub-DIs
Module design
The module contains the source data areas (in example 472+468) and a parent data area, e.g. Resource (a sum area is also possible).
The source DIs and the calculating DI are included in the module.
New from S 39.5.23 and C 39.5.21
Vertical Date Lines Below Scale
Objective
In addition to horizontal bars, particular dates are to be visualized by vertical lines below the scale.
Procedure
Open the bar DI for the required dates, e.g. DI002951 in the Data Items module.
Enter the required symbol, e.g. 001354, in the secondary symbol ID field in the required SUBDI record, e.g. DI006786.
Save.
Restart the server.
Modules with Histograms (Utilization Diagrams)
Information
Histograms are bars in a utilization diagram. This representation is shown below a time scale along with a histogram scale.
Procedure
From C 39.5.17
Data area
Include one or more histogram bar data fields in the required data area NEW depending on the construction of the bar DI and the objective of the utilization module.
In case the histogram data is to be summarized, include them in the target area and select the required value in the Summarization type field. Fill the Grid field in the target area as well.
Module
For the data area with histogram bars,
define the [CustomizingScaleAreas][scale area]] as a parent area (directly or indirectly via the structure of the data areas)
define the Scale and Grid parameters. They define the total height (fixed height) or height of the individual grid units (flexible height) of the utilization diagram.
Define the scale for the scale area on module data area assignment level in the Scale field.
Up to C 39.5.17
Data area
Include histogram bar data fields in the required data area.
In case the histogram data is to be summarized, include them in the target area and select the required value in the Summarization type field. Fill the Grid field in the target area as well.
Module
For the data area with histogram bars,
define the [CustomizingScaleAreas][scale area]] as a parent area (directly or indirectly via the structure of the data areas)
define the Scale and Grid parameters. They define the total height (fixed height) or height of the individual grid units (flexible height) of the utilization diagram.
Define the scale for the scale area on module data area assignment level in the Scale field.
Attention
It is not allowed to customize projections and histograms in the same data area. If you ignore this, a Python error message is output when the module is used.
Customizing Example: Utilization diagrams with histogram and projected values
Objective
To visualize the figures for the associated histogram bars in addition to a utilization diagram.
Contains the source data fields, e.g. DI HISTO summ. avail. cap or proj. avail. cap. The histogram bar must be in Window 9, because there is no histogram scale field in this data area.
Since the values can only be displayed under a scale, they must have a Grid on data field level, e.g. 3 for Week. The grid should be the same in all data areas of this module.
Load data area
Also contains the source data fields and the complex DIs (in this case the projected values proj. a load and proj. r load).
The Period and Load data areas receive Fulfillment = since they do not have sub-DIs.
The Period, Load, and VG/Resource data areas are to be set to Never display = . The other data areas are to be displayed.
The resource data area with the histogram bar contains the scale = 500. The size of the scale is calculated using the grid in this data area.
By indenting individual data areas, you can get a better overview.
Attention
It is not allowed to customize projections and histograms in the same data area. If you ignore this, a Python error message is output when the module is used.
Modules with Gantt Chart
Information
Bars serve to graphically display periods under a time scale.
Customizing
Data area
Include the required schedule data fields and the respective bar data fields in the required data area.
Include the data area with bar data fields in the required module and insert the scale area as a parent area.
Examples for
the customizing of a module (schedule) with a Gantt chart as well as bar helper fields and tooltips can be found in Module Workflow Level 2.
Linkage (Customize Links/Network Plans)
Information
Linkage is when objects are organized via the predecessor/successor relation to the networks.
The linkage between the objects is visualized by lines.
Customizing procedure
Data areas
Object data area, e.g. task
Linkage data area, e.g. link
In this data area, include the Linkage DI which visualizes the link between the objects in the module mentioned above.
Since the linkage is used for linking bars (it is hence visible in the Gantt chart), set the Linkage DI to Window = 3 like the bar data fields, and set Filter criteria = .
Module
Subordinate the link data area to the object data area.
 .
. 
 and output =
