The documentation from version 39.5.17 of PLANTA project can be found in the new PLANTA Online Help .
.
Scale Object Customizing
Information- In modules, the scale must always be customized above the corresponding scale objects.
Time Scale
Information- Time scale data items form time scales under which time-related objects (e.g. bars, number values etc.) can be positioned.
- A scale DI always represents a grid for a scale area.
- Scale areas are formed by several scale data fields.
- Create a time scale DI with class = 3 for DT400 Micellaneous objects in the Data Dictionary module.
- In the Data Items module,
- in the Data Items module. For sub-DIs:
- Define functions in the Function field.
- Allocate the symbols in this field: For this purpose, enter the required symbol ID in the SUBDI symbol ID field.
- in the Data Items module. For sub-DIs:
New from C 39.5.9
Notes for today lines
- The today line is a firm part of each scale. That is why it also has a fixed layout.
- If a deviating layout for the today line is required, e.g. if you want it to have a different color or to even be invisible, the today line must be customized.
- To do so, a scale DI with Function = TL must be adopted and the ID of the required symbol must be stored in the SUBDI symbol ID field.
Histogram Scale
Information- The histogram scale enables histogram bars to be displayed together with a time scale.
- Unlike time scale DIs, the histogram scale DI is not customized in a specific scale area. It is adopted to the same data area as the histogram bars.
- Create a histogram DI with class = 12 for DT400 Miscellaneous objects in the Data Dictionary module.
- DB type determines the formatting of the histogram scale grid in the module.
- in the Data Items module,
- define its function and
- allocate the symbols
- in the Data Items module.
- The grid line is displayed as a horizontal line graduated in accordance with the data field parameters.
- The histogram scales are used together with the histogram bars for the customizing of utilization diagrams.
New from C 39.5.9
Notes for today lines
- The today line is a firm part of each scale. That is why it also has a fixed layout.
- If a deviating layout for the today line is required, e.g. if you want it to have a different color or to even be invisible, the today line must be customized.
- To do so, a scale DI with Function = TL must be adopted and the ID of the required symbol must be stored in the SUBDI symbol ID field.
Scale Objects
Date Bar
Information- Date bars are used to display the duration of , e.g., tasks in the form of bars below a time scale.
- A date bar is a complex DI, which can change its symbol depending on sub-DIs (milestone, critical, non-critical, completed, etc.).
- Create a bar DI with class = 1 for DT400 Miscellaneous objects in the required data table in the Data Dictionary module.
- In the Data Items module,
- assign two arbitrary sub-DIs of the DF type = D (Date) to the bar DI:
- Assign symbols. The symbol assignment defines the display of the bars in the module.
- The required symbol in the Symbol DI field is assigned to a bar without traffic light function.
- Example in the standard: the Requested date bar (DI002001)
- In case the bar changes its display depending on different values (traffic light function), further sub-DIs are assigned.
- These sub-DIs have the Function A or D. Their customizing equates to the customizing of traffic light sub-DIs.
- Example in the standard: the date bar of the calculated dates (DI002951)
- The order or dominance of the sub-DIs is defined via the Pos. parameter.
- These sub-DIs have the Function A or D. Their customizing equates to the customizing of traffic light sub-DIs.
- A combination of both variants is possible, too. In this case,
- the sub-DI symbols overwrite the DI symbol
- If no condition of the sub-DIs is satisfied, the DI symbol is displayed.
- Example in the standard: the actual date bar (DI002005)
- All sub-DIs must originate from the same or a parent data table.
- The required symbol in the Symbol DI field is assigned to a bar without traffic light function.
- Date bars cannot be displayed without a time scale since they enable positioning.
- Date bars are used together with time scales in scale areas for the customizing of modules with Gantt charts.
Histogram bars
Information- Histogram bars display values as bars below a scale. The values must be assignable to a date.
From C 39.5.17/S 39.5.20
- Option 1
- Open a DT in the Data Dictionary module, from which the values for the histogram are to be taken, and create a histogram bar DI with Class = 2.
- In the Data Items module, assign sub-DIs of a particular bar type to the histogram bar DIs.
- Define the function of sub-DIs:
- assign Symbol ID.
- If a histogram DI is built in this way, several histogram bar DIs need to be added to the load module in the correct order depending on the objective of the load module. A histogram bar in the application, hence, corresponds to a histogram bar DI in the Customizer. Display in the module: the lower a histogram bar DI is positioned in the data area, the further the histogram bar is displayed in the foreground of the application.
DIs in data area 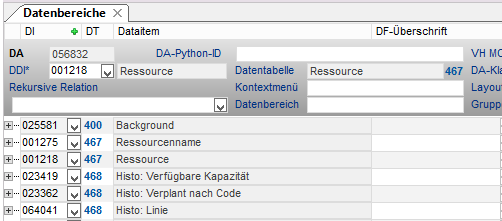
Structure of DIs 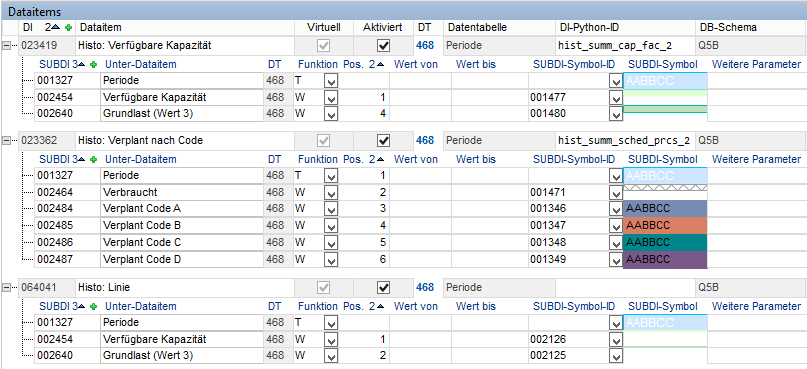
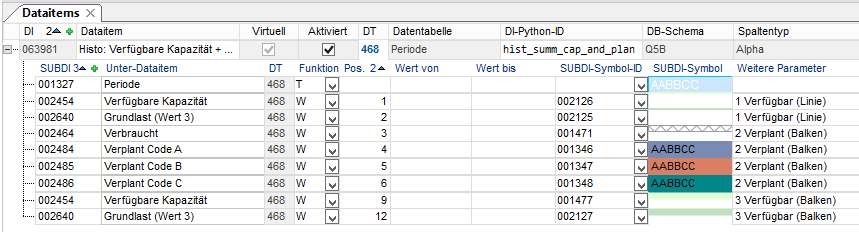
Display in application 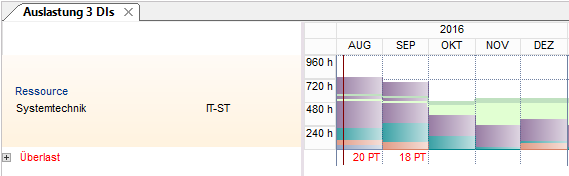
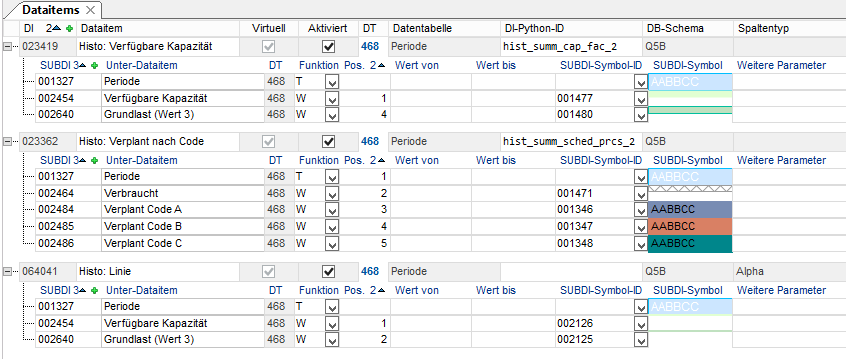
- Option 2 NEW
- In the Data Dictionary module, open a DT from which the values for the histogram are to be taken and create a histogram bar DI with Class = 2.
- In the Data Items module, assign sub-DIs of different functional bar groups to the histogram bar DI.
- Define the function of sub-DIs:
- assign Symbol ID.
- Summarize the sub-DIs of the same bar group by making the same entry in the Miscellaneous parameters.
- If a histogram DI is built in this way, only this one histogram DI needs to be added to the load module. In the application, a histogram bar then corresponds to a group in the Customizer. Display in the module: the lower a histogram bar group is positioned in the histogram bar DI, the further the histogram bar is displayed in the background of the application.
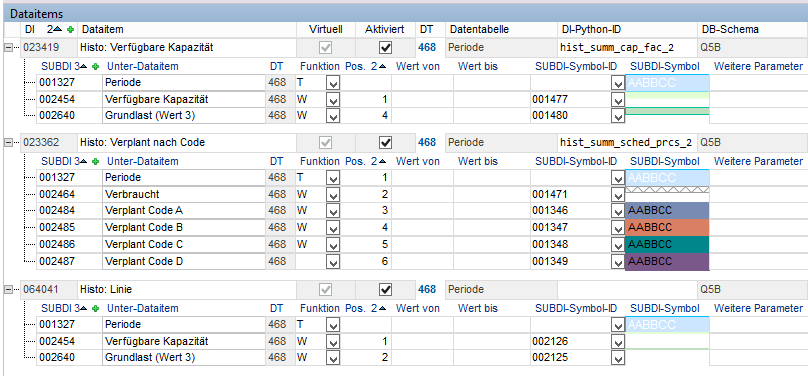
DIs in data area 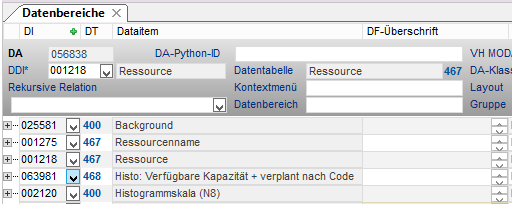
Structure of DIs 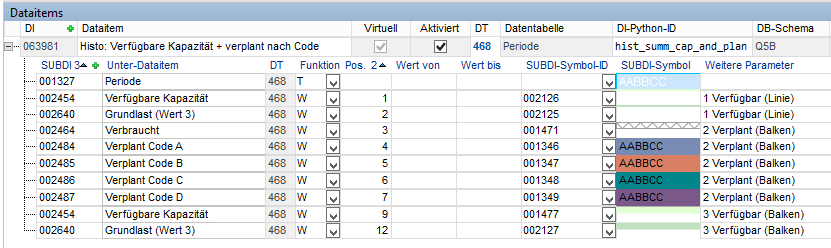
Display in application 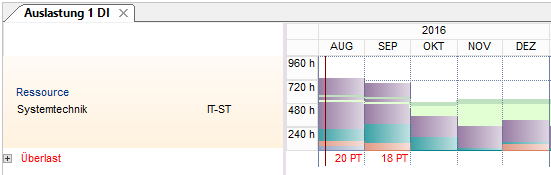
Up to C 39.5.17
- In the Data Dictionary module, open a DT from which the values for the histogram are to be taken and create a histogram bar DI with Class = 2.
- In the Data Items module,
- The histogram scales are used together with the histogram scales for the utilization diagram customizing.
Linkage
Information- DIs of this Class are used for the display of structures, especially for network structures, e.g., for links in the Gantt chart.
- A linkage data item is displayed in modules as a line between two objects. Their appearance is determined by the sub-DI symbols.
- Create a time scale DI with class = 8 for DT400 Miscellaneous objects in the Data Dictionary module.
- In the Data Items module, assign the sub-DIs to the Linkage DI
Projection
Information- Projection data items display numeric values under a time scale.
- Numeric values must be assignable to a date.
- In the Data Dictionary module, create a projection DI for DT400 Miscellaneous objects with Class = 11.
- In the Data Items module,
- assign sub-DIs to the projection DIs.
- carry out the preallocation for the projection DI in the Summarization type field if necessary.
- If a deviating value is entered in the field of the same name on data field level when embedding the DI in a module, the deviating value takes effect.
- The value (V) is displayed below the time scale at the position that corresponds to the date D.
- If the module construction requires multiple values to be projected, you can either create a projection DI for each value or one single protection DI with multiple sub-DIs with function = W.
- Number formats are ineffective on projection data fields since they are not numeric. They must be set in the DI (function = W).
- Customizing of modules with protection
From DB 39.5.10
Notes
- For projection data fields, the summarization can be deactivated by setting the Summarization type = 5 on the respective data item; this cannot be achieved by setting a Summarization type on the data field or by overwriting. NEW When setting the Summarization type = 5 on projection data fields, a message indicating this is output.
- In grouped data areas, the DI with Summarization type = 5 as well as its DI dependencies as data fields must already exist or be created.
From S 39.5.17
Notes
- For projection data fields, the summarization can be deactivated by setting the Summarization type = 5 on the respective data item; this cannot be achieved by setting a Summarization type on the data field or by overwriting.
- In grouped data areas, the DI with Summarization type = 5 as well as its DI dependencies as data fields must already exist or be created.


| I | Attachment | History | Size | Date | Comment |
|---|---|---|---|---|---|
| |
Auslastung1.PNG | r1 | 7.8 K | 2016-08-06 - 03:36 | |
| |
Auslastung3.PNG | r1 | 7.9 K | 2016-08-06 - 03:41 | |
| |
DBER1.PNG | r1 | 14.7 K | 2016-08-06 - 03:35 | |
| |
DBER3.PNG | r1 | 14.6 K | 2016-08-06 - 03:40 | |
| |
Dataitems1.PNG | r2 r1 | 28.3 K | 2016-08-09 - 01:39 | |
| |
Dataitems3.PNG | r4 r3 r2 r1 | 37.3 K | 2016-08-09 - 01:53 |
|