Die Dokumentation ab Version 39.5.17 von PLANTA project finden Sie in der neuen PLANTA Online-Hilfe .
.
Customizing von Charts
Information- In PLANTA project können interaktive Charts erstellt werden, die folgende Vorteile im Vergleich zu Excel-Charts besitzen:
- Interaktivität mit PLANTA-Systemen:
- Zoomen der Charts
- Dynamische Anzeige des mit der Maus berührten Chart-Wertes als Toolbox
- Animation:
- 3D-Charts.
- Anzeigen unterschiedlicher Werte pro Einheit
- Setzen der Chartw-Werte zur Laufzeit
- Interaktivität mit PLANTA-Systemen:
Allgemeine Vorgehensweise
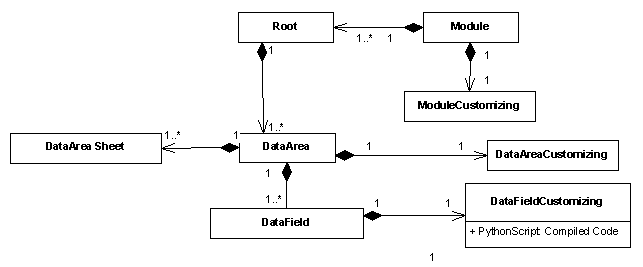
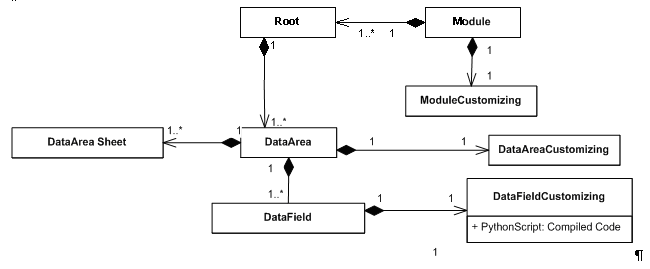
Voraussetzung- Um die Charts zu nutzen, muss man ein Modul erstellen mit einem Datenbereich, der die zu visualisierenden Daten z.B. Aufwand oder Kosten, enthält.
- Dieser Datenbereich wird als Quelldatenbereich für den Chart genutzt.
- In der Datenbereichszuordnung muss der Parameter Raw Format aktiviert werden.
- Dieser Parameter ist standardmäßig im Fenster 9 und kann eingeblendet werden.
- Der Quelldatenbereich muss sichtbar sein d.h. Nie anzeigen darf nicht aktiviert sein. Anzeige = 0 "Nicht anzeigen" ist möglich.
Anlegen eines Chart-Datenbereichs
Vorgehensweise- Oberhalb des Quellbereichs einen weiteren Datenbereich anlegen.
- Folgendes Dataitem zuordnen:
- DF = 004336 Button/IronPython
- Folgende Parameter setzen:
- DF-Verhalten = py
- DF-Höhe: Höhe des Charts
- DF-Breite: Breite des Charts
- Speichern. Anschließend Datenbereich neu öffnen, damit das Datenfeld zur Eingabe des Skripts sichtbar wird.
- Die Datenfelder DF-Höhe und DF-Breite sind in der Modulvariante Layout oder können alternativ eingeblendet werden.
Anlegen des Chart-Skripts
Vorgehensweise- Für das Chart-Datenfeld im Feld IronPython Skript folgenden Code einfügen:
###Automatically generated###
###Changes will be overwritten###
Charthelper=ConsoleScope['Charthelper']
PPMS_chart_generator=ConsoleScope['PPMS_chart_generator']
#Initialize variables
df_reference={}
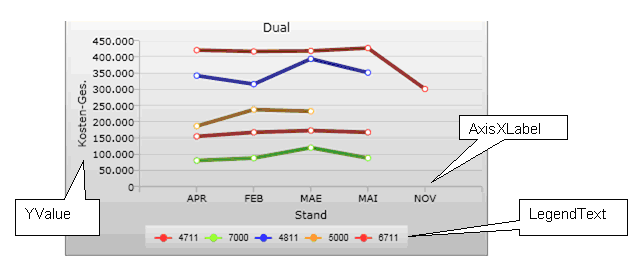
df_reference["AxisXLabel"]=""
df_reference["LegendText"]=""
df_reference["XValue"]=""
df_reference["YValue"]=""
df_reference["ZValue"]=""
df_reference["AxisYLabel"]=""
df_reference["YAxisSuffix"]=""
df_reference["XAxisSuffix"]=""
df_reference["Event"]=""
title=""
da_id=""
xaml_colorset=""
xaml_background_brush=""
xaml_dataseries=""
xaml_chart=""
#Execute datafield configuration
exec(df.Customizing.PythonScriptSettings)
#Get charthelper object
ch = Charthelper(df, df_reference, da_id)
#Get value dictionary
value_dict = ch.value_dict
"""Create PPMS_chart_generator instance
para.1 - xaml_chart, no default value
para.2 - xaml_dataseries, no default value
para.3 - xaml_colorset, no default value
para.4 - xaml_background_brush, no default value
para.5 - dict_values: dictionary, default empty dictionary
para.6 - AxesX _label: String, default empty
para.7 - AxesY _label: String, default empty
para.8 - Title: String, default --> AxesX _label + "/" + AxesY _labell """
#Create PPMS Chart
chart_panel = PPMS_chart_generator(xaml_chart, xaml_dataseries, xaml_colorset, xaml_background_brush, dict_values=ch.value_dict, AxesX _label=ch.get_di_title(df_reference["AxisXLabel"]), AxesY _label=ch.get_di_title(df_reference["AxisYLabel"]), Title=title, modlayout=moduleLayout, dict_event=ch.event_dict, suffix_dict=ch.suffix)
#Get PMS Chart panel
ctl = chart_panel.winpanelSetzen der Skript-Parameter
Vorgehensweise- Folgendes Template in das Feld Datenfeld-Konfiguration einkopieren.
xaml_chart=""""""
xaml_dataseries=""""""
xaml_colorset=""""""
xaml_background_brush=""""""

#Initialize datarea_id and chart_title -variable
da_id=""
title=df.DataArea.Customizing.Name

"""Define Chart - Properties"""

#Set datafield_id for chart_values
df_reference={}
df_reference["AxisXLabel"]=""
df_reference["LegendText"]=""
df_reference["XValue"]=""
df_reference["YValue"]=""
df_reference["ZValue"]=""
df_reference["AxisYLabel"]="" - Hierbei werden folgende Parameter festgelegt. Für jeden Chart-Typ müssen andere Parameter gesetzt werden.
xaml_chart |
Erstellung des Chart-Objektes |
xaml_dataseries |
Template zur Erstellung der Datenpaarobjekte. Legt den Chart-Typ fest |
xaml_colorset |
Setzen der Farbe für ein Datenpaar. Wenn keine Angaben gemacht werden, wird ein Default-Wert genommen. |
xaml_background_brush |
Setzen der Hintergrundfarbe. Wenn keine Angaben gemacht werden, wird ein Default-Wert genommen. |
verbatim>da_id: |
Angabe des Datenbereichs, aus dem die Daten bezogen werden. Die Datenbereichs-ID muss mit führender Null angegeben werden. |
title: |
Angabe des Chart-Titels. |
df_reference: |
Jeder Chart-Parameter wird durch Angabe der DF-ID mit einem PLANTA-Datenfeld aus dem Quellbereich referenziert. |
- Im Modul Iron Python-Charts werden Beispiel-Charts für die verschiedenen Chart-Typen angezeigt. Mit STRG + F3 auf dem "X" über den Charts kann in den dazugehörigen Datenbereich gewechselt werden.
Setzen der XAML-Parameter
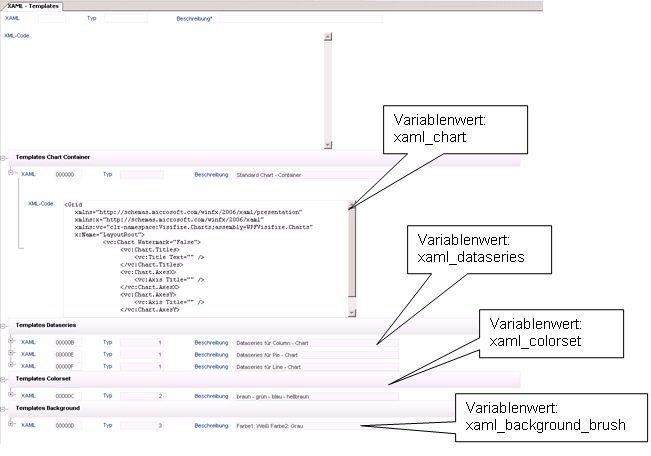
Vorgehensweise- Customizer Stammdaten --> XAML - Templates aufrufen.
- Hier können für die XAML-Variablen xaml_chart, xaml_dataseries, xaml_colorset und xaml_background_brush im Datenfeld XML-Code die jeweiligen XAMLs ausgewählt werden.
- Den entsprechenden XAML-Code kopieren und an der dazugehörigen Stelle im Skript im Datenfeld Datenfeld-Konfiguration einfügen.
- Speichern.
Setzen der Parameter da_id und title
Vorgehensweise- Setzen der Parameter wie folgt:
- da_id: ID des Quell-DA aus Datenfeld DA ohne führende Nullen angeben.
- title: Chart-Titel angeben.
- Mit df.DataArea.Customizing.Name wird der im Datenfeld Datenbereich hinterlegte Titel des Chart-Datenbereichs angezeigt.
Setzen der df_reference
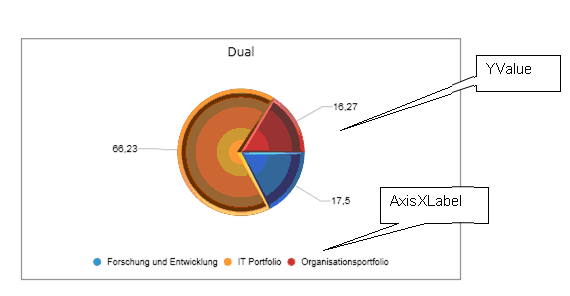
Pie-Chart
Vorgehensweise- Setzen der Parameter wie folgt:
#Set datafield_id for chart_values
df_reference["AxisXLabel"]= Angabe der Feldnummer zum Setzen der Beschriftung
df_reference["LegendText"]=""
df_reference["XValue"]=""
df_reference["YValue"]= Angabe der Feldnummer zum Setzen der Werte
df_reference["ZValue"]=""
df_reference["AxisYLabel"]=""
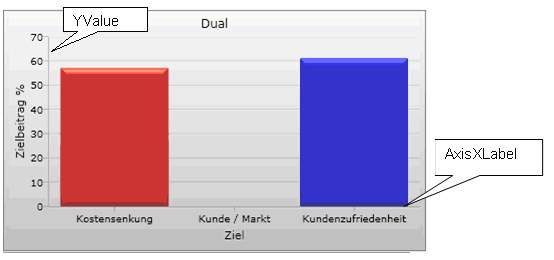
Column-Chart
Vorgehensweise- Setzen der Parameter wie folgt:
#Set datafield_id for chart_values
df_reference["AxisXLabel"]= Angabe der Feldnummer zum Setzen der X-Achsen Beschriftung
df_reference["LegendText"]=""
df_reference["XValue"]=""
df_reference["YValue"]= Angabe der Feldnummer zum Setzen der Y-Werte
df_reference["ZValue"]=""
df_reference["AxisYLabel"]=df_reference["YValue"]
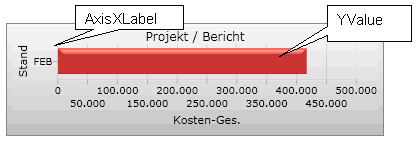
Bar-Chart
Vorgehensweise- Setzen der Parameter wie folgt:
#Set datafield_id for chart_values
df_reference["AxisXLabel"]= Angabe der Feldnummer zum Setzen der Einheitsbeschriftung
df_reference["LegendText"]=""
df_reference["XValue"]=""
df_reference["YValue"]= Angabe der Feldnummer zum Setzen des Balkenwertes
df_reference["ZValue"]=""
df_reference["AxisYLabel"]=df_reference["YValue"]
Line-Chart
Vorgehensweise- Setzen der Parameter wie folgt:
#Set datafield_id for chart_values
df_reference["AxisXLabel"]= Angabe der Feldnummer zum Setzen der Einheitsbeschriftung
df_reference["LegendText"]= Angabe der Feldnummer zum Setzen der Legendenbeschriftung
df_reference["XValue"]=""
df_reference["YValue"]= Angabe der Feldnummer zum Setzen des Balkenwertes
df_reference["ZValue"]=""
df_reference["AxisYLabel"]=df_reference["YValue"]
Modulstart
Vorgehensweise- Nachdem alle Parameter gesetzt wurden:
- Speichern.
- Modul starten.
Charts für Meilensteintrendanalyse (MTA)
Einführung
Informationen- Die Meilensteintermineinschätzungen von Projektvorgängen können mithilfe der Meilensteintrendanalyse (MTA) als Diagramm bzw. Chart dargestellt werden.
- Die Darstellung einer Meilensteintrendanalyse wird über ein Modul-Customizing umgesetzt und kann mit den folgenden Beschreibungen nachvollzogen werden.
- Zur Darstellung der Charts wird auf die Chart-Komponente Visifire zurückgegriffen.
- Die Logik zur Anzeige von MTA-Charts ist in einem IronPython-Modul implementiert.
- Das MTA-Modul kann über ein IronPython-Makro angesprochen werden.
Eine Liste von Vorgangsserien mit einem Meilensteintrendanalyse-Chart anzeigen
Vorgehensweise- Ein Modul anlegen
- Die benötigten Datenbereiche und Datenfelder anlegen
- Datenbereich aus Datentabelle 354 (Dummy)
- Datenbereich aus Datentabelle 824 (Vorgang) mit folgenden Datenfeldern
- 008445 Vorgangs-ID
- 008636 Vorgangsbezeichnung
- 008642 Meilenstein
- 008805 Status vom
- 008625 Kalk. Ende
- Den Datenbereich aus Datentabelle 824 dem Dummy-Datenbereich unterordnen.
- Das folgende IronPython-Skripts in das Datenfeld IronPython Skript des Platzhalter-Datenfelds einfügen:
import clr
import sys

# Debug: results in reloaded module to reflect code changes in MilestoneChart
# sys.modules.Remove("MTA")
# sys.modules.Remove("MTA.milestone_chart")

from System import DateTime
from System.Windows.Forms import *
from System.Windows.Media import Brushes

from MTA.milestone_chart import milestone_chart
from MTA.milestone_dataseries import milestone_dataseries
from MTA.time_interval_enum import time_interval_enum


# Used global variables from DataField-Configurations
# - targetDataAreaId
# - processIdField
# - processCaptionField
# - reportDateField
# - targetDateField
# - milestoneField
# - milestoneFilter
# - chartTitleField
# report date = Berichtszeitpunkt
# target date = Meilensteintermin
exec(df.Customizing.PythonScriptSettings)

# Get DataAreaRecords
targetDataArea=targetDataAreaId
records=[]
roots=list(df.Module.Roots)
for root in roots:
    dataAreas=list(root.DAManager)
    for dataAreaRecord in dataAreas:
        if dataAreaRecord.Customizing.Uid == targetDataArea:
            records.append(dataAreaRecord)

seriesList = {}
fields = {}

# Get field associations from data field configuration
fields["ProcessID"] = processIdField
fields["ProcessCaption"] = processCaptionField
fields["Milestone"] = milestoneField
fields["ReportDate"] = reportDateField
fields["TargetDate"] = targetDateField
fields["ChartTitle"] = chartTitleField

# Initialize milestone value filter
criterias = {}
criterias["Milestone"]=[milestoneFilter]

# Extract needed field-values from records
for record in records:
    values = {}
    areaCU = record.Customizing
    for key in fields.keys():
        fieldCU = areaCU.ChildrenDFC.TryGetValue(fields[key])[1]
        field = record.ChildrenDF.__getitem__(fieldCU)
        value = field.GetValue[str]()
        values[key] = value

    # Filter by milestone value
    if values["Milestone"] in criterias["Milestone"]:
        if values["ReportDate"] != None and values["TargetDate"] != None:
            if values["ProcessID"] not in seriesList.keys():
                seriesList[values["ProcessID"]] = milestone_dataseries()
            # Create Series from values
            series = seriesList[values["ProcessID"]]
            reportDate = DateTime.Parse(values["ReportDate"])
            targetDate = DateTime.Parse(values["TargetDate"])
            series.data_points.Add(reportDate, targetDate)
            if values["ProcessCaption"] != None and values["ProcessCaption"] != "":
                series.title = values["ProcessCaption"]

# Create Chart
chart = milestone_chart(seriesList.values())

#If necessary, define custom time interval here:
#chart.current_time_interval = time_interval_enum.quarters

# Set Chart title from specified DataField
chart.chart_title=df.DataArea.Customizing.ChildrenDFC.TryGetValue(chartTitleField)[1].Title

# Finally render chart do client-control
ctl = chart.get_element_host()- Speichern
Anpassungen am IronPython-Skript
- Konfiguration des IronPython-Skript
- Im Skript kann eine Liste von Variablennamen eingesehen werden, denen entsprechende Feldnummern zugewiesen werden müssen („targetDataArea", „reportDateField" etc.).
- Das Setzen einer solchen Konfigurationsvariable erfolgt nach dem Schema Variable = "<Wert>" in der Datenfeldkonfiguration des Platzhalter-Datenfelds
Hinweise zur Meilensteintrendanalye-Charts
- Die Legendeneinträge im Chart werden aus dem Feld Vorgangsbezeichnung bezogen
- In den Tooltips der einzelnen Datenpunkte werden zur Vorgangsbezeichnung jeweils Berichtszeitpunkt (Status vom) und Meilensteintermin (Kalk. Ende) angezeigt
- Das Zeitintervall der Achsenbeschriftungen und des Chart-Rasters wird dynamisch in Abhängigkeit von Chart-Abmessungen/Zoom-Level und Datenmenge festgelegt.
Technische Informationen zur API der Meilensteintrendanalyse
MTA-API Reference (IronPython)
Class milestone_chart
| Member | Type | Comment | |
|---|---|---|---|
time_interval |
Enum of type time_interval_enum |
Sets the time interval for label distance and chart grid. This property is set to _time_interval_enum.automatic by default, but can be overvritten with any value of the specified enumeration. In case of time_interval_enum.automatic, the time interval is dynamically choosen according to chart dimensions and data. |
|
current_data_series |
List of chart data series. Data series must be provided as instances of type milestone_dataseries. |
If chart rendering is started without this property set up, an exception will be thrown. | |
chart_title |
Specifies the string used as chart title | If no chart title is set up, a hard coded, unlocalized string will be used: "Meilenstein-Trendanalyse" | |
| Method | Parameters | Return value | Comment |
|---|---|---|---|
milestone_chart (dataSeries) (constructor) |
Optional: List of chart data series. Data series must be provided as instances of type milestone_dataseries. |
Returns a new instance of milestone_chart. | If source data is not specified in the constructor parameter, it has to be assigned to the current_data_series property later. |
get_element_host() |
none |
Returns the configured chart object wrapped up in an instance of ElementHost | ElementHost is a wrapper-class that enables the use of WPF-Controls inside WinForms-Applications. As the supplied chart is such a WPF-Control, the call of this method is a needed when using the chart in combination with WinForms. |
get_chart_grid() |
none | Returns the configured chart object wrapped up in an instance of Grid (a WPF-UI-Control) | When using the chart within a WPF-Form, this method can be called instead of using the wrapper method get_element_host(). As the chart is native WPF-Control there is no need for a wrapper-control in case of WPF-Appliances. |
Class milestone_dataseries
| Member | Type | Comment | |
|---|---|---|---|
| data_points | A dictionary containing the DateTime-Pairs representing the source data for the milestone chart. Both X (report date) and Y (estimated finish date) milestone values have to be assigned as DateTime-objects. |
In order to use the data series with milestone_chart, at least the DataPoints property has to be set up after creating the instance. | |
| title | Optional. Specifiy a fixed caption for this data series. | By default, series title is optained from source data (DataField 08636, Process Caption) | |
| color | Optional. Specifiy a fixed color for all data points of this series. | By default, color of data points is choosen automatically for each series. | |
| Method | Parameters | Return value | Comment |
|---|---|---|---|
milestone_dataseries() |
none | Returns a new instance of milestone_dataseries | In order to use the data series with milestone_chart, at least the data_points property has to be set up after creating the instance. See property data_points for further information. |
Technische Informationen zum Einbinden der Charts
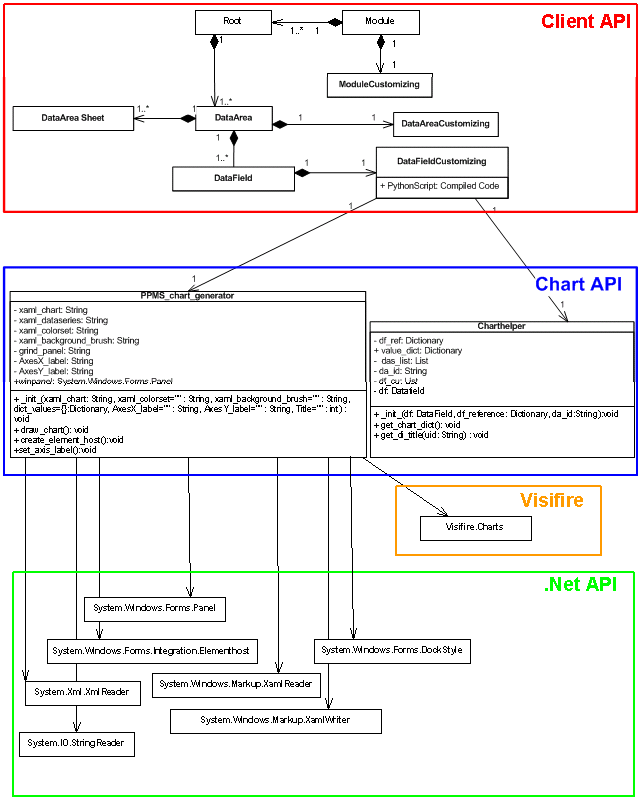
Informationen- Zur Initialisierung der Visifire Charts, muss zunächst eine IronPython-Klasse (PPMS_Chart_generator) erstellt werden, welche das Zeichnen der Charts übernimmt.
- Zum Zeichnen der Charts wird auf die .Net API, wie auch auf die Visifire DLLs zugegriffen.
- Eine weitere IronPython-Klasse (Charthelper) kümmert sich um die Datenaufbereitung. Sie verwendet die PLANTA-Client API.
- Beide Klassen werden in das Clientverzeichnis ausgelagert, sodass sie über die IronPython-Schnittstelle des PLANTA-Clients genutzt werden können.
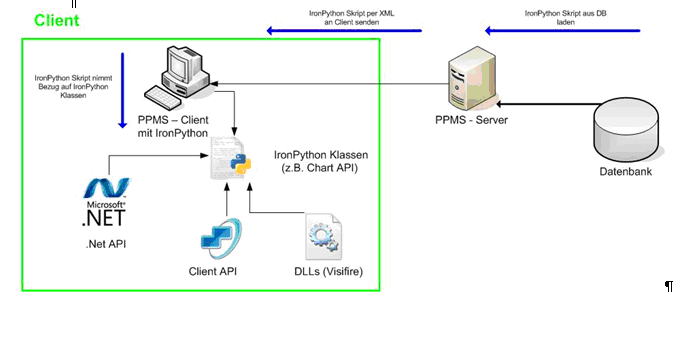
- Der Zugriff auf die definierten Klassen erfolgt über die PLANTA Software. Hierbei wird ein Python-Skript, zum Initialisieren der Charts, vom Server zum Client gesendet. Dies erfolgt in einem Modul, welches neben dem Skript auch alle Daten beinhaltet.
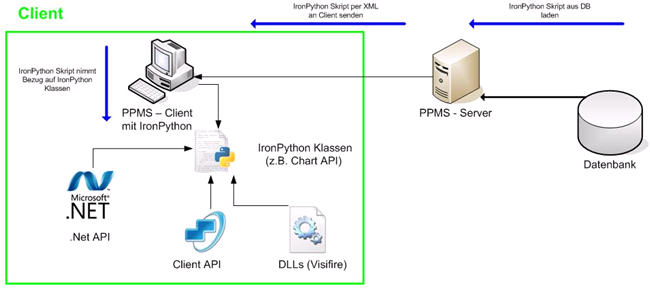
Chart-Design erstellen
Das Chart-Design wird über XAML beschrieben, das zur Erstellung von WPF-basierten Oberflächen genutzt wird. Beispiel:<Grid
xmlns="http://schemas.microsoft.com/winfx/2006/xaml/presentation"
xmlns:x="http://schemas.microsoft.com/winfx/2006/xaml"
xmlns:vc="clr-namespace:Visifire.Charts;assembly=WPFVisifire.Charts"
x:Name="LayoutRoot"
<vc:Chart Watermark="False"> </Grid>Implementierung der IronPython-Klassen
Ausführen von IronPython-Skripts am Client- Zur Darstellung von Charts im Programm können Skripte im DataFieldCustomizing von Datafields hinterlegt werden.
- Der Zugriff auf alle Daten erfolgt über das Datafield-Objekt, in dem sich das Skript befindet.
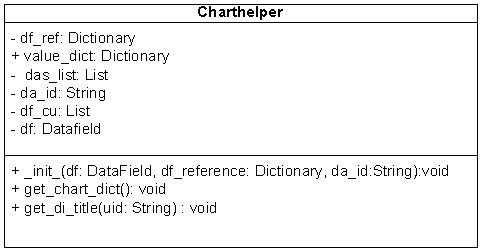
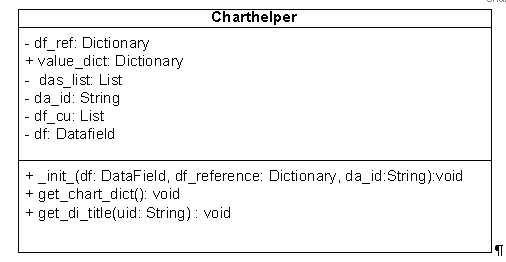
 Klasse: Charthelper
 - Aufgabe: Aufbereitung der Daten
- Speicherort: Clientverzeichnis
- Details:
- Name: charthelper
- Attribute:
- df: Type DataField - kein Default-Wert
- Object der Klasse DataField in der sich das Chart-Skript befindet.
- df_reference: Type Dictionary (Python Hash-Table) - kein Default-Wert
- Jeder Chart-Parameter wird mit einem Datafield verbunden.
- da_id: Type String - optional
- Angabe des Dataareas, aus dem die Daten bezogen werden.
- Defaultmäßig wird der Dataarea in dem sich der Chart befindet referenziert.
- df: Type DataField - kein Default-Wert
- Methoden:
-
__init__(): Konstruktor- Setzt die Attribute und startet die Methode
get_chart_dict().
- Setzt die Attribute und startet die Methode
-
get_chart_dict: void- Führt die Datenaufbereitung durch, anhand der Parameter die in
df_reference, festgelegt wurden.- Liefert die aufbereiteten Daten als Dictionary(Hash-Table) zurück.
- Welches an die
PPMS_Chart_generatorKlasse weitergeleitet werden kann.
- Welches an die
- Liefert die aufbereiteten Daten als Dictionary(Hash-Table) zurück.
- Führt die Datenaufbereitung durch, anhand der Parameter die in
-
get_di_title: String- Parameter: UID eines Datafields
- Return: Gibt den Datafield-Titel zurück
-
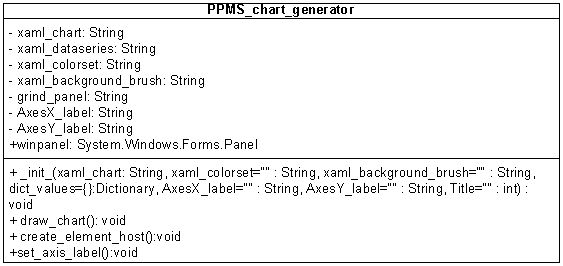
 Klasse: PPMS_chart_generator
 - Erstellung der Klasse PPMS_chart_generator mit IronPython zur Generierung der Charts, anhand der aufbereiteten Daten aus der Klasse Charthelper.
- Die PPMS_chart_generator Klasse wird in das Clientverzeichnis ausgelagert.
- Details:
- Klassenname:
PPMS_chart_generator - Konstruktor-Parameter:
-
xaml_chart: Type String(XML) - Erstellung des Chart-Objektes.
- Kein Default-Wert.
-
-
xaml_dataseries: Type String (XML)- Template zur Erstellung der Datenpaarobjekte.
- Legt den Chart-Typ fest.
- Die jeweiligen Daten werden im Konstruktor gesetzt.
- Kein Default-Wert.
- Template zur Erstellung der Datenpaarobjekte.
-
xaml_colorset: Type String(XML)- Setzen der Farbe für ein Datenpaar.
- Wenn keine Angaben gemacht werden, wird ein Default-Wert genommen.
-
xaml_background_brush: Type String(XML)- Setzen der Hintergrundfarbe mit Farbverläufen.
- Wenn keine Angaben gemacht werden, wird ein Default-Wert genommen.
-
dict_values: Type Dictionary (Hash Table)- Aufbereitetes Daten-Dictionary der Klasse Charthelper()
- QAxesX_label: Type String
- Beschriftung für X - Achse.
- QAxesY_label: Type String
- Beschriftung für Y - Achse.
- Title: Type String
- Chart-Titel
- Klassenname:
- Methoden:
-
__init__(): Konstruktor- Setzt die Attribute und startet die Chart-Erstellung.
-
create_element_host():- Setzt den WPF Chart in einen Element host.
- Element host: Verknüpft WPF Controls mit Windows.Forms Controls.
- Wird benötigt, da der Client auf der Windows.Forms Library basiert.
- Element host: Verknüpft WPF Controls mit Windows.Forms Controls.
- Setzt den WPF Chart in einen Element host.
-
set_values():- Fügt die Datenpaare der Dataseries hinzu.
- Werte werden dem Chart hinzugefügt.
- Fügt die Datenpaare der Dataseries hinzu.
-
- Verwendete Klassen aus der .Net API:
- System.IO.!QStringReader
- System.Xml.!XmlReader
- System.Windows.Markup.!QXamlReader
- System.Windows.Markup.!QXamlWriter
- System.Windows.Forms.Integration.!QElementHost
- System.Windows.Forms.Panel
- System.Windows.Forms.!QDockStyle
- Verwendete Klassen aus der Visifire API:
- Visifire.Charts
 UML-Diagramm aller verwendeten Klassen:
Public Python Charting-API Reference
Charthelper (charthelper.py)
The Charthelper-class provides methods to prepare raw data for usage within charts. Depending on the specified chart-parameters, values are convertet to be suitable for the Visifire-API.| Member | Type | Comment | |
|---|---|---|---|
| df | DataField | The DataField -Object containing the current Python-Script | |
| df_reference | Dictionary | The Dictionary matching the Chart-Parameters with their DataField -equivalents | |
| da_id | String | The DataArea where raw data is obtained from | |
| Method | Parameters | Return value | Comment |
| Charthelper(df: DataField , df_reference: Dictionary, da_id: DataArea ) | df, DataField The DataField -Object containing the current Python-Script df_reference, Dictionary da_id, String |
see comment | Initializes the Charthelper-Instance with default values and then calls get_chart_dict(). |
| get_chart_dict() | none | Writes processed values into value_dict | Prepares the given raw data for use with PPMS_chart_generator. The processing applied to the data depends on the parameters found in df_reference |
| get_di_title(Uid: String) | Uid, String Uid of the desired DataField |
Returns a String containing the title of the DataField with the specified UID. | |
PPMS_chart_generator (chart_generator.py)
The PPMS_chart_generator-class provides methods for chart-generation with use of custom XAML-formating. Note that generation of charts depends on data that has been processed by an instance of the Charthelper-Class before.| Method | Parameters | Return value | Comment |
|---|---|---|---|
| PPMS_chart_generator(xaml_chart: String, xaml_colorset="": String, xaml_background_brush="": String, dict_values={}: Dictionary, AxesX _label="": String, AxesY _label="":String, Title="": int) | xaml_chart, String XAML-Code used as basic Chart-Template xaml_dataseries, String XAML-Code that detemines the Chart-type (e.g. bars, pie) xaml_colorset, String XAML-Code used for formating of data-series xaml_background_brush, String XAML-Code used for formating of chart background dict_values, Dictionary Contains the prepared data used for chart generation QAxesX_label, String Caption of the X-Axis QAxesY_label, String Caption of the Y-Axis |
After execution, class-member winpanel contains a Chart-Control ready for usage | The produced control can be used within Windows Forms appliances |
| create_element_host() | none | Assigns a new instance of ElementHost (containing generated Chart) to class-member winpanel | To reflect changes of properties, the chart needs to be redrawn via draw_chart() and then embedded into an ElementHost via create_element_host() |
| draw_chart() | none | String containing the XAML-rendering code for current chart. | see also: create_element_host() |
Initialisierung der Charts per Skript
DF-Konfiguration
Information- Die Chart-spezifischen Parameter werden in einem Konfigurationsfeld im DataFieldCustomizing gespeichert.
- Parameter
- Typ (Pie-, Bar-Chart ...)
- Hintergrundfarbe
- Referenz zu Daten
- ...
- Parameter
- Die Parameter werden zum Instanzieren der Charthelper- und PPMS_chart_generator - Klasse benötigt.
xaml_chart="""<Grid
        xmlns="http://schemas.microsoft.com/winfx/2006/xaml/presentation"
            xmlns:x="http://schemas.microsoft.com/winfx/2006/xaml"
            xmlns:vc="clr-namespace:Visifire.Charts;assembly=WPFVisifire.Charts"
        <x:Name="LayoutRoot">
            <vc:Chart Watermark="False">
                <vc:Chart.Titles>
                    <vc:Title Text="" />
                </vc:Chart.Titles>
                <vc:Chart.AxesX>
                    <vc:Axis Title="" />
                </vc:Chart.AxesX>
                <vc:Chart.AxesY>
                    <vc:Axis Title="" />
                </vc:Chart.AxesY>
            <vc:Chart>
        <Grid>"""

xaml_dataseries="""<UserControl
            xmlns="http://schemas.microsoft.com/winfx/2006/xaml/presentation"
                xmlns:x="http://schemas.microsoft.com/winfx/2006/xaml"
                xmlns:vc="clr-namespace:Visifire.Charts;
                               <assembly=WPFVisifire.Charts">
             <vc:Chart>
                <vc:Chart.Series>
                    vc:DataSeries RenderAs="Pie" MarkerEnabled="True"
                           <MarkerType="Circle" LegendText="">
                </vc:Chart.Series>
            </vc:Chart>
        </UserControl>"""

xaml_colorset=""
xaml_background_brush=""
"""Define Chart - Properties"""
da_id='42162'
#Set datafield_id for chart_values
df_reference={}
df_reference["AxisXLabel"]="134082"
df_reference["LegendText"]=""
df_reference["XValue"]=""
df_reference["YValue"]="142717"
df_reference["ZValue"]=""
df_reference["AxisYLabel"]= df_reference["YValue"]
title=df.Dataarea.Customizing.Name
IronPython-Skript
Informationen- Der Aufruf der Charthelper- und PPMS_chart_generator -Klasse, erfolgt im IronPython-Skriptfeld (siehe DataFieldCustomizing.PythonScript), welches im DataFieldCustomizing gespeichert wird.
- Dieses Skript ist für alle Chartmakros gleich und kann bei Änderung leicht für alle Charts geändert werden.
- Die chartspezifischen Eigenschaften werden aus dem Konfigurationsfeld ausgelesen.
###Automatically generated###
###Changes will be overwritten###
from charthelper import Charthelper
from chart_generator import PPMS_chart_generator
#Execute datafield configuration
exec(df.Customizing.PythonScriptSettings)
#Get charthelper object
ch = Charthelper(df, df_reference, da_id)
#Get value dictionary
value_dict = ch.value_dict
"""Create PPMS_chart_generator instance
para.1 - xaml_chart, no default value
para.2 - xaml_dataseries, no default value
para.3 - xaml_colorset, no default value
para.4 - xaml_background_brush, no default value
para.5 - dict_values: dictionary, default empty dictionary
para.6 - AxesX _label: String, default empty
para.7 - AxesY _label: String, default empty
para.8 - Title: String, default --> AxesX _label + "/" + AxesY _labell """
#Create PPMS Chart
chart_panel = PPMS_chart_generator(xaml_chart, xaml_dataseries, xaml_colorset, xaml_background_brush, dict_values=ch.value_dict, AxesX _label=ch.get_di_title(df_reference["AxisXLabel"]), AxesY _label=ch.get_di_title(df_reference["AxisYLabel"]), Title=title)
#Get PMS Chart panel
ctl = chart_panel.winpanel
#Delete datafield variables
del xaml_chart
del xaml_dataseries
del da_id
del df_reference
del title
del ch
del value_dict
del chart_panel
del Charthelper
del PPMS_chart_generator
del xaml_background_brush
del xaml_colorset


| I | Attachment | History | Size |
Date | Comment |
|---|---|---|---|---|---|
| |
Charts.doc | r1 | 832.0 K | 2009-10-13 - 11:05 | |
| |
Chart5.png | r2 r1 | 52.5 K | 2009-10-13 - 14:06 | |
| |
XAMLTemplates.png | r2 r1 | 46.2 K | 2009-10-13 - 11:26 | |
| |
Chart9.png | r4 r3 r2 r1 | 39.1 K | 2009-10-13 - 14:16 | |
| |
Chart4.png | r1 | 10.0 K | 2009-09-24 - 13:52 | |
| |
Chart1.png | r1 | 6.8 K | 2009-09-24 - 13:34 | |
| |
Chart2.png | r1 | 5.8 K | 2009-09-24 - 13:41 | |
| |
Chart8.png | r2 r1 | 5.4 K | 2009-10-13 - 14:14 | |
| |
Chart6.png | r2 r1 | 4.0 K | 2009-10-13 - 14:10 | |
| |
Chart7.png | r2 r1 | 3.7 K | 2009-10-13 - 14:12 | |
| |
Chart3.png | r1 | 3.0 K | 2009-09-24 - 13:44 |
|