Customizing von Charts
Information- In PLANTA project können interaktive Charts erstellt werden, die folgende Vorteile im Vergleich zu Excel-Charts besitzen:
- Interaktivität mit PLANTA-Systemen:
- Zoomen der Charts
- Dynamische Anzeige des mit der Maus berührten Chartwertes als Toolbox
- Animation:
- 3D Charts.
- Anzeigen unterschiedlicher Werte pro Einheit
- Setzen der Chartwerte zur Laufzeit
- Interaktivität mit PLANTA-Systemen:
Allgemeines
Vorgehensweise
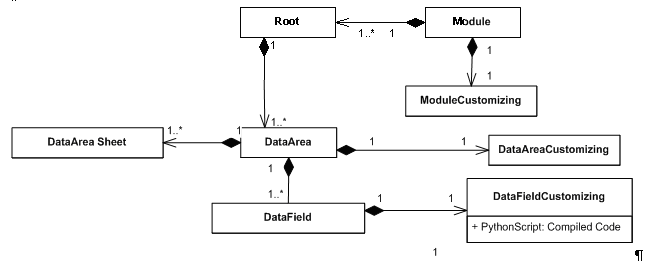
Voraussetzung- Um die Charts zu nutzen, muss man ein Modul erstellen mit einem Datenbereich, der die zu visualisierenden Daten z.B. Aufwand oder Kosten, enthält.
- Dieser Datenbereich wird als Quelldatenbereich für den Chart genutzt.
- In der Datenbereichszuordnung muss der Parameter Raw Format aktiviert werden.
- Dieser Parameter ist standardmäßig im Fenster 9 und kann eingeblendet werden.
- Der Quelldatenbereich muss sichtbar sein d.h. Nie anzeigen darf nicht aktiviert sein. Anzeige = 0 "Nicht anzeigen" ist möglich.
Anlegen eines Chart-Datenbereichs
Vorgehensweise- Oberhalb des Quellbereichs einen weiteren Datenbereich anlegen:
- Folgendes Dataitem zuordnen:
- DF = 004336 Button/IronPython
- Folgende Parameter setzen:
- DF-Verhalten = py
- DF-Höhe: Höhe des Charts
- DF-Breite: Breite des Charts
- Speichern. Anschließend Datenbereich neu öffnen, damit das Datenfeld zur Eingabe des Skripts sichtbar wird.
- Die Datenfelder DF-Höhe und DF-Breite sind in der Modulvariante Layout oder können alternativ eingeblendet werden.
Anlegen des Chartskripts
Vorgehensweise- Für das Chartdatenfeld im Feld IronPython Skript folgenden Code einfügen:
###Automatically generated### ###Changes will be overwritten### Charthelper=ConsoleScope['Charthelper'] PPMS_chart_generator=ConsoleScope['PPMS_chart_generator'] #Initialize variables df_reference={} df_reference["AxisXLabel"]="" df_reference["LegendText"]="" df_reference["XValue"]="" df_reference["YValue"]="" df_reference["ZValue"]="" df_reference["AxisYLabel"]="" df_reference["YAxisSuffix"]="" df_reference["XAxisSuffix"]="" df_reference["Event"]="" title="" da_id="" xaml_colorset="" xaml_background_brush="" xaml_dataseries="" xaml_chart="" #Execute datafield configuration exec(df.Customizing.PythonScriptSettings) #Get charthelper object ch = Charthelper(df, df_reference, da_id)

#Get value dictionary value_dict = ch.value_dict """Create PPMS_chart_generator instance para.1 - xaml_chart, no default value para.2 - xaml_dataseries, no default value para.3 - xaml_colorset, no default value para.4 - xaml_background_brush, no default value para.5 - dict_values: dictionary, default empty dictionary para.6 - AxesX _label: String, default empty para.7 - AxesY _label: String, default empty para.8 - Title: String, default --> AxesX _label + "/" + AxesY _labell """ #Create PPMS Chart chart_panel = PPMS_chart_generator(xaml_chart, xaml_dataseries, xaml_colorset, xaml_background_brush, dict_values=ch.value_dict, AxesX _label=ch.get_di_title(df_reference["AxisXLabel"]), AxesY _label=ch.get_di_title(df_reference["AxisYLabel"]), Title=title, modlayout=moduleLayout, dict_event=ch.event_dict, suffix_dict=ch.suffix) #Get PMS Chart panel ctl = chart_panel.winpanel
Setzen der Skript-Parameter
Vorgehensweise- Folgendes Template in das Feld Datenfeld-Konfiguration einkopieren.
- Hierbei werden folgende Parameter festgelegt:
-
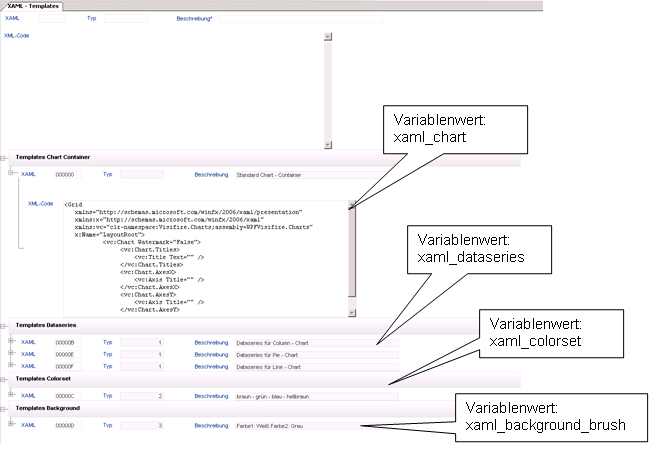
xaml_chart
- Erstellung des Chartobjektes.
-
xaml_dataseries
- Template zur Erstellung der Datenpaarobjekte.
- Legt den Charttyp fest.
- Template zur Erstellung der Datenpaarobjekte.
-
xaml_colorset
- Setzen der Farbe für ein Datenpaar.
- Wenn keine Angaben gemacht werden, wird ein Default-Wert genommen.
-
xaml_background_brush
- Setzen der Hintergrundfarbe.
- Wenn keine Angaben gemacht werden, wird ein Default-Wert genommen.
-
da_id:
- Angabe des Datenbereichs, aus dem die Daten bezogen werden. Die Datenbereichs-ID muss mit führender Null angegeben werden.
-
title:
- Angabe des Charttitels.
-
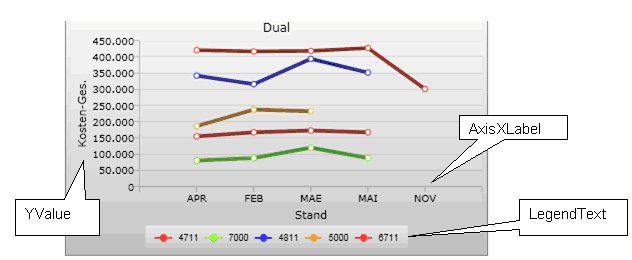
df_reference:
- Jeder Chartparameter wird durch Angabe der DF-ID mit einem PLANTA-Datenfeld aus dem Quellbereich referenziert.
- Für jeden Charttyp müssen andere Parameter gesetzt werden.
-
xaml_chart="""""" xaml_dataseries="""""" xaml_colorset="""""" xaml_background_brush=""""""

#Initialize datarea_id and chart_title -variable da_id="" title=df.DataArea.Customizing.Name

"""Define Chart - Properties""" da_id=''

#Set datafield_id for chart_values df_reference={} df_reference["AxisXLabel"]="" df_reference["LegendText"]="" df_reference["XValue"]="" df_reference["YValue"]="" df_reference["ZValue"]="" df_reference["AxisYLabel"]="" - Im Modul Chart-Templates werden Beispiel-Charts für die verschiedenen Chart-Typen angezeigt. Mit STRG + F3 auf dem "X" über den Charts kann in den dazugehörigen Datenbereich gewechselt werden.
Setzen der XAML-Parameter
Vorgehensweise- Customizer -> Stammdaten -> XAML - Templates aufrufen.
- Hier können für die XAML-Variablen xaml_chart, xaml_dataseries, xaml_colorset und xaml_background_brush im Datenfeld XML-Code die jeweiligen XAMLs ausgewählt werden.
- Den entsprechenden XAML-Code kopieren und an der dazugehörigen Stelle im Skript im Datenfeld Datenfeld-Konfiguration einfügen.
- Speichern.
Setzen der Parameter da_id und title
Vorgehensweise- Setzen der Parameter wie folgt:
- da_id: ID des Quell-DA aus Datenfeld DA ohne führende Nullen angeben.
- title: Charttitel angeben.
- Mit df.DataArea.Customizing.Name wird der im Datenfeld Datenbereich hinterlegte Titel des Chart-Datenbereichs angezeigt.
Setzen der df_reference
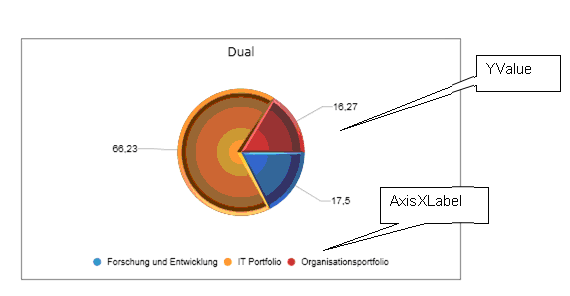
Pie-Chart
Vorgehensweise- Setzen der Parameter wie folgt:
#Set datafield_id for chart_values df_reference["AxisXLabel"]= Angabe der Feldnummer zum Setzen der Beschriftung df_reference["LegendText"]="" df_reference["XValue"]="" df_reference["YValue"]= Angabe der Feldnummer zum Setzen der Werte df_reference["ZValue"]="" df_reference["AxisYLabel"]=""
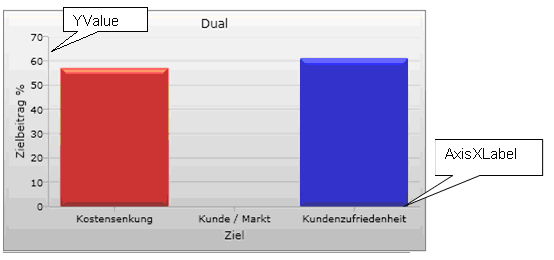
Column-Chart
Vorgehensweise- Setzen der Parameter wie folgt:
#Set datafield_id for chart_values df_reference["AxisXLabel"]= Angabe der Feldnummer zum Setzen der X-Achsen Beschriftung df_reference["LegendText"]="" df_reference["XValue"]="" df_reference["YValue"]= Angabe der Feldnummer zum Setzen der Y-Werte df_reference["ZValue"]="" df_reference["AxisYLabel"]=df_reference["YValue"]
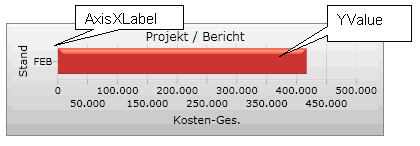
Bar-Chart
Vorgehensweise- Setzen der Parameter wie folgt:
#Set datafield_id for chart_values df_reference["AxisXLabel"]= Angabe der Feldnummer zum Setzen der Einheitsbeschriftung df_reference["LegendText"]="" df_reference["XValue"]="" df_reference["YValue"]= Angabe der Feldnummer zum Setzen des Balkenwertes df_reference["ZValue"]="" df_reference["AxisYLabel"]=df_reference["YValue"]
Line-Chart
Vorgehensweise- Setzen der Parameter wie folgt:
#Set datafield_id for chart_values df_reference["AxisXLabel"]= Angabe der Feldnummer zum Setzen der Einheitsbeschriftung df_reference["LegendText"]= Angabe der Feldnummer zum Setzen der Legendenbeschriftung df_reference["XValue"]="" df_reference["YValue"]= Angabe der Feldnummer zum Setzen des Balkenwertes df_reference["ZValue"]="" df_reference["AxisYLabel"]=df_reference["YValue"]
Modulstart
Vorgehensweise- Nachdem alle Parameter gesetzt wurden:
- Speichern.
- Modul starten.
Charts für Meilensteintrendanalyse (MTA)
Einführung
Informationen- Die Meilensteintermineinschätzungen von Projektvorgängen können mithilfe der Meilensteintrendanalyse (MTA) als Diagramm bzw. Chart dargestellt werden.
- Die Darstellung einer Meilensteintrendanalyse wird über ein Modul-Customizing umgesetzt und kann mit den folgenden Beschreibungen nachvollzogen werden.
- Zur Darstellung der Charts wird auf die Chart-Komponente Visifire zurückgegriffen
- Die Logik zur Anzeige von MTA-Charts ist in einem IronPython-Modul implementiert
- Das MTA-Modul kann über ein IronPython-Makro angesprochen werden.
Eine Liste von Vorgangsserien mit einem Meilensteintrendanalyse-Chart anzeigen
Vorgehensweise- Ein Modul anlegen
- Die benötigten Datenbereiche und Datenfelder anlegen
- Datenbereich aus Datentabelle 354 (Dummy)
- Datenbereich aus Datentabelle 824 (Vorgang) mit folgenden Datenfeldern
- 008445 Vorgangs-ID
- 008636 Vorgangsbezeichnung
- 008642 Meilenstein
- 008805 Status vom
- 008625 Kalk. Ende
- Den Datenbereich aus Datentabelle 824 dem Dummy-Datenbereich unterordnen.
- Das folgende IronPython-Skripts in das Datenfeld IronPython Skript des Platzhalter-Datenfelds einfügen:
import clr
import sys

# Debug: results in reloaded module to reflect code changes in MilestoneChart
# sys.modules.Remove("MTA")
# sys.modules.Remove("MTA.milestone_chart")

from System import DateTime
from System.Windows.Forms import *
from System.Windows.Media import Brushes

from MTA.milestone_chart import milestone_chart
from MTA.milestone_dataseries import milestone_dataseries
from MTA.time_interval_enum import time_interval_enum


# Used global variables from DataField-Configurations
# - targetDataAreaId
# - processIdField
# - processCaptionField
# - reportDateField
# - targetDateField
# - milestoneField
# - milestoneFilter
# - chartTitleField
# report date = Berichtszeitpunkt
# target date = Meilensteintermin
exec(df.Customizing.PythonScriptSettings)

# Get DataAreaRecords
targetDataArea=targetDataAreaId
records=[]
roots=list(df.Module.Roots)
for root in roots:
    dataAreas=list(root.DAManager)
    for dataAreaRecord in dataAreas:
        if dataAreaRecord.Customizing.Uid == targetDataArea:
            records.append(dataAreaRecord)

seriesList = {}
fields = {}

# Get field associations from data field configuration
fields["ProcessID"] = processIdField
fields["ProcessCaption"] = processCaptionField
fields["Milestone"] = milestoneField
fields["ReportDate"] = reportDateField
fields["TargetDate"] = targetDateField
fields["ChartTitle"] = chartTitleField

# Initialize milestone value filter
criterias = {}
criterias["Milestone"]=[milestoneFilter]

# Extract needed field-values from records
for record in records:
    values = {}
    areaCU = record.Customizing
    for key in fields.keys():
        fieldCU = areaCU.ChildrenDFC.TryGetValue(fields[key])[1]
        field = record.ChildrenDF.__getitem__(fieldCU)
        value = field.GetValue[str]()
        values[key] = value

    # Filter by milestone value
    if values["Milestone"] in criterias["Milestone"]:
        if values["ReportDate"] != None and values["TargetDate"] != None:
            if values["ProcessID"] not in seriesList.keys():
                seriesList[values["ProcessID"]] = milestone_dataseries()
            # Create Series from values
            series = seriesList[values["ProcessID"]]
            reportDate = DateTime.Parse(values["ReportDate"])
            targetDate = DateTime.Parse(values["TargetDate"])
            series.data_points.Add(reportDate, targetDate)
            if values["ProcessCaption"] != None and values["ProcessCaption"] != "":
                series.title = values["ProcessCaption"]

# Create Chart
chart = milestone_chart(seriesList.values())

#If necessary, define custom time interval here:
#chart.current_time_interval = time_interval_enum.quarters

# Set Chart title from specified DataField
chart.chart_title=df.DataArea.Customizing.ChildrenDFC.TryGetValue(chartTitleField)[1].Title

# Finally render chart do client-control
ctl = chart.get_element_host()- Speichern
Anpassungen am IronPython-Skript
- Konfiguration des IronPython-Skript
- Im Skript kann eine Liste von Variablennamen eingesehen werden, denen entsprechende Feldnummern zugewiesen werden müssen („targetDataArea", „reportDateField" etc.).
- Das Setzen einer solchen Konfigurationsvariable erfolgt nach dem Schema Variable = "<Wert>" in der Datenfeldkonfiguration des Platzhalter-Datenfelds
Hinweise zur Meilensteintrendanalye-Charts
- Die Legendeneinträge im Chart werden aus dem Feld Vorgangsbezeichnung bezogen
- In den Tooltips der einzelnen Datenpunkte werden zur Vorgangsbezeichnung jeweils Berichtszeitpunkt (Status vom) und Meilensteintermin (Kalk. Ende) angezeigt
- Das Zeitintervall der Achsenbeschriftungen und des Chart-Rasters wird dynamisch in Abhängigkeit von Chart-Abmessungen/Zoom-Level und Datenmenge festgelegt.
Technische Informationen zur API der Meilensteintrendanalyse
MTA-API Reference (IronPython)
Class milestone_chart
| Member | Type | Comment | |
|---|---|---|---|
| time_interval | Enum of type time_interval_enum_ | Sets the time interval for label distance and chart grid. This property is set to time_interval_enum.automatic by default, but can be overvritten with any value of the specified enumeration. In case of _time_interval_enum.automatic, the time interval is dynamically choosen according to chart dimensions and data. | |
| current_data_series | List of chart data series. Data series must be provided as instances of type milestone_dataseries. | If chart rendering is started without this property set up, an exception will be thrown. | |
| chart_title | Specifies the string used as chart title | If no chart title is set up, a hard coded, unlocalized string will be used: "Meilenstein-Trendanalyse" | |
| Method | Parameters | Return value | Comment |
| milestone_chart(dataSeries) (constructor) | Optional: List of chart data series. Data series must be provided as instances of type milestone_dataseries. | Returns a new instance of milestone_chart. | If source data is not specified in the constructor parameter, it has to be assigned to the current_data_series property later. |
| get_element_host() | none |
Returns the configured chart object wrapped up in an instance of ElementHost | ElementHost is a wrapper-class that enables the use of WPF-Controls inside WinForms-Applications. As the supplied chart is such a WPF-Control, the call of this method is a needed when using the chart in combination with WinForms. |
| get_chart_grid() | none | Returns the configured chart object wrapped up in an instance of Grid (a WPF-UI-Control) | When using the chart within a WPF-Form, this method can be called instead of using the wrapper method get_element_host(). As the chart is native WPF-Control there is no need for a wrapper-control in case of WPF-Appliances. |
Class milestone_dataseries
| Member | Type | Comment | |
|---|---|---|---|
| data_points | A dictionary containing the DateTime-Pairs representing the source data for the milestone chart. Both X (report date) and Y (estimated finish date) milestone values have to be assigned as DateTime-objects. | In order to use the data series with milestone_chart, at least the DataPoints property has to be set up after creating the instance. | |
| title | Optional. Specifiy a fixed caption for this data series. | By default, series title is optained from source data (DataField 08636, Process Caption) | |
| color | Optional. Specifiy a fixed color for all data points of this series. | By default, color of data points is choosen automatically for each series. | |
| Method | Parameters | Return value | Comment |
| milestone_dataseries() | none | Returns a new instance of milestone_dataseries | In order to use the data series with milestone_chart, at least the data_points property has to be set up after creating the instance. See property data_points for further information. |
Technische Informationen zum Einbinden der Charts
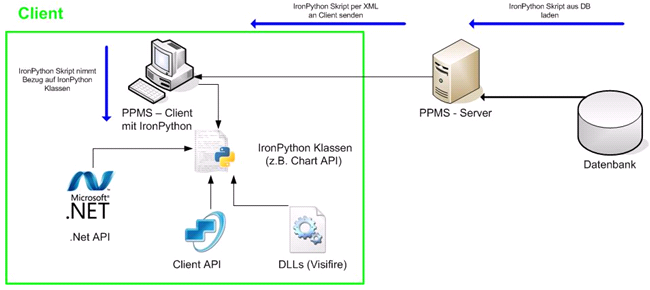
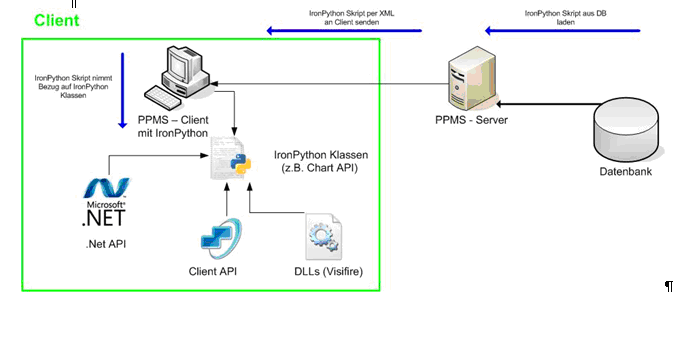
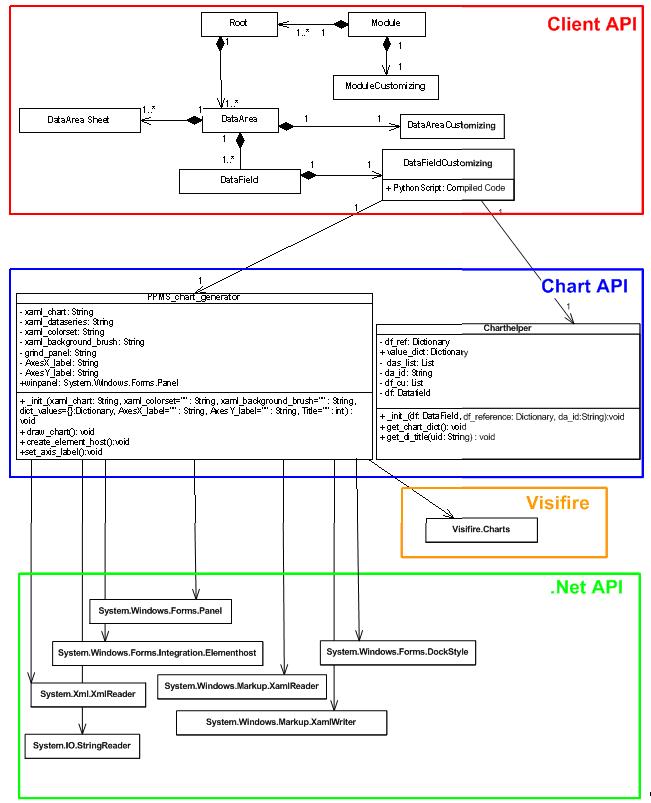
Informationen- Zur Initialisierung der Visifire Charts, muss zunächst eine IronPython-Klasse (PPMS_Chart_generator) erstellt werden, welche das Zeichnen der Charts übernimmt.
- Zum Zeichnen der Charts wird auf die .Net API, wie auch auf die Visifire DLLs zugegriffen.
- Eine weitere IronPython-Klasse (Charthelper) kümmert sich um die Datenaufbereitung. Sie verwendet die PLANTA-Client API.
- Beide Klassen werden in das Clientverzeichnis ausgelagert, sodass sie über die IronPython-Schnittstelle des PLANTA-Clients genutzt werden können.
- Der Zugriff auf die definierten Klassen erfolgt über die PLANTA Software. Hierbei wird ein Python-Skript, zum Initialisieren der Charts, vom Server zum Client gesendet. Dies erfolgt in einem Modul, welches neben dem Skript auch alle Daten beinhaltet.
Chartdesign erstellen
Das Chartdesign wird über XAML beschrieben, das zur Erstellung von WPF-basierten Oberflächen genutzt wird. Beispiel:<Grid
xmlns="http://schemas.microsoft.com/winfx/2006/xaml/presentation"
xmlns:x="http://schemas.microsoft.com/winfx/2006/xaml"
xmlns:vc="clr-namespace:Visifire.Charts;assembly=WPFVisifire.Charts"
x:Name="LayoutRoot"
<vc:Chart Watermark="False"> </Grid>Implementierung der IronPython-Klassen
Ausführen von IronPython-Skripts am Client- Zur Darstellung von Charts im Programm können Skripte im DataFieldCustomizing von Datafields hinterlegt werden.
- Der Zugriff auf alle Daten erfolgt über das Datafield-Objekt, in dem sich das Skript befindet.
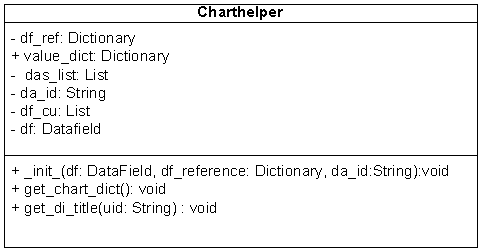
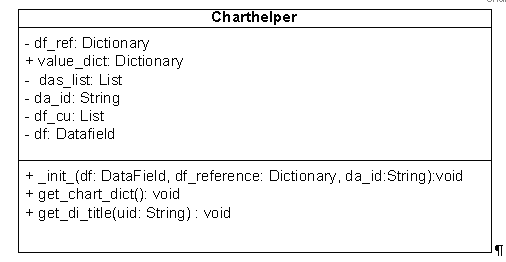
 Klasse: Charthelper
 - Aufgabe: Aufbereitung der Daten
- Speicherort: Clientverzeichnis
- Details:
- Name: charthelper
- Attribute:
- df: Type DataField - kein Default-Wert
- Object der Klasse DataField in der sich das Chartskript befindet.
- df_reference: Type Dictionary (Python Hash-Table) - kein Default-Wert
- Jeder Chartparameter wird mit einem Datafield verbunden.
- da_id: Type String - optional
- Angabe des Dataareas, aus dem die Daten bezogen werden.
- Defaultmäßig wird der Dataarea in dem sich der Chart befindet referenziert.
- df: Type DataField - kein Default-Wert
- Methoden:
- __init__(): Konstruktor
- Setzt die Attribute und startet die Methode get_chart_dict().
- get_chart_dict: void
- Führt die Datenaufbereitung durch, anhand der Parameter die in df_reference, festgelegt wurden.
- Liefert die aufbereiteten Daten als Dictionary(Hash-Table) zurück.
- Welches an die PPMS_Chart_generator Klasse weitergeleitet werden kann.
- Liefert die aufbereiteten Daten als Dictionary(Hash-Table) zurück.
- Führt die Datenaufbereitung durch, anhand der Parameter die in df_reference, festgelegt wurden.
- get_di_title: String
- Parameter: UID eines Datafields
- Return: Gibt den Datafield-Titel zurück
- __init__(): Konstruktor
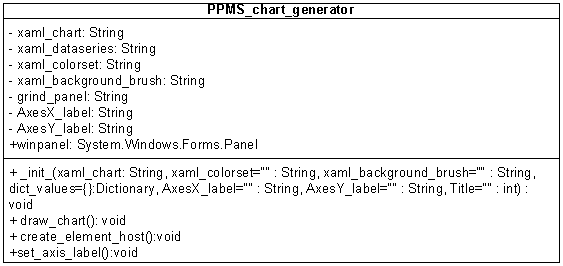
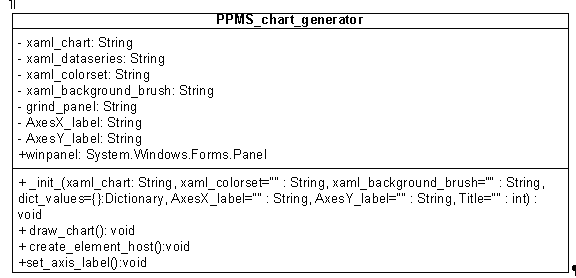
 Klasse: PPMS_chart_generator
 - Erstellung der Klasse PPMS_chart_generator mit IronPython zur Generierung der Charts, anhand der aufbereiteten Daten aus der Klasse Charthelper.
- Die PPMS_chart_generator Klasse wird in das Clientverzeichnis ausgelagert.
- Details:
- Klassenname: PPMS_chart_generator
- Konstruktor-Parameter:
- xaml_chart: Type String(XML)
- Erstellung des Chartobjektes.
- Kein Default-Wert.
- xaml_dataseries: Type String (XML)
- Template zur Erstellung der Datenpaarobjekte.
- Legt den Charttyp fest.
- Die jeweiligen Daten werden im Konstruktor gesetzt.
- Kein Default-Wert.
- Template zur Erstellung der Datenpaarobjekte.
- xaml_colorset: Type String(XML)
- Setzen der Farbe für ein Datenpaar.
- Wenn keine Angaben gemacht werden, wird ein Default-Wert genommen.
- xaml_background_brush: Type String(XML)
- Setzen der Hintergrundfarbe mit Farbverläufen.
- Wenn keine Angaben gemacht werden, wird ein Default-Wert genommen.
- dict_values: Type Dictionary (Hash Table)
- Aufbereitetes Daten-Dictionary der Klasse Charthelper()
- QAxesX_label: Type String
- Beschriftung für X - Achse.
- QAxesY_label: Type String
- Beschriftung für Y - Achse.
- Title: Type String
- Charttitel
- Methoden:
- __init__(): Konstruktor
- Setzt die Attribute und startet die Charterstellung.
- create_element_host():
- Setzt den WPF Chart in einen Element host.
- Element host: Verknüpft WPF Controls mit Windows.Forms Controls.
- Wird benötigt, da der Client auf der Windows.Forms Library basiert.
- Element host: Verknüpft WPF Controls mit Windows.Forms Controls.
- Setzt den WPF Chart in einen Element host.
- set_values():
- Fügt die Datenpaare der Dataseries hinzu.
- Werte werden dem Chart hinzugefügt.
- Fügt die Datenpaare der Dataseries hinzu.
- __init__(): Konstruktor
- Verwendete Klassen aus der .Net API:
- System.IO.!QStringReader
- System.Xml.!XmlReader
- System.Windows.Markup.!QXamlReader
- System.Windows.Markup.!QXamlWriter
- System.Windows.Forms.Integration.!QElementHost
- System.Windows.Forms.Panel
- System.Windows.Forms.!QDockStyle
- Verwendete Klassen aus der Visifire API:
- Visifire.Charts
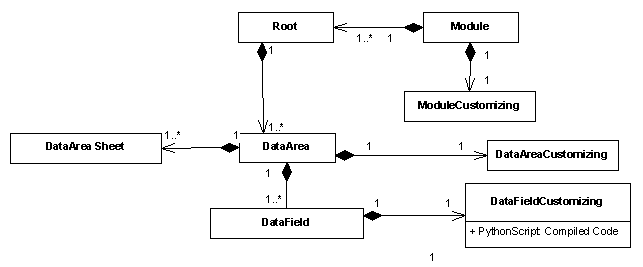
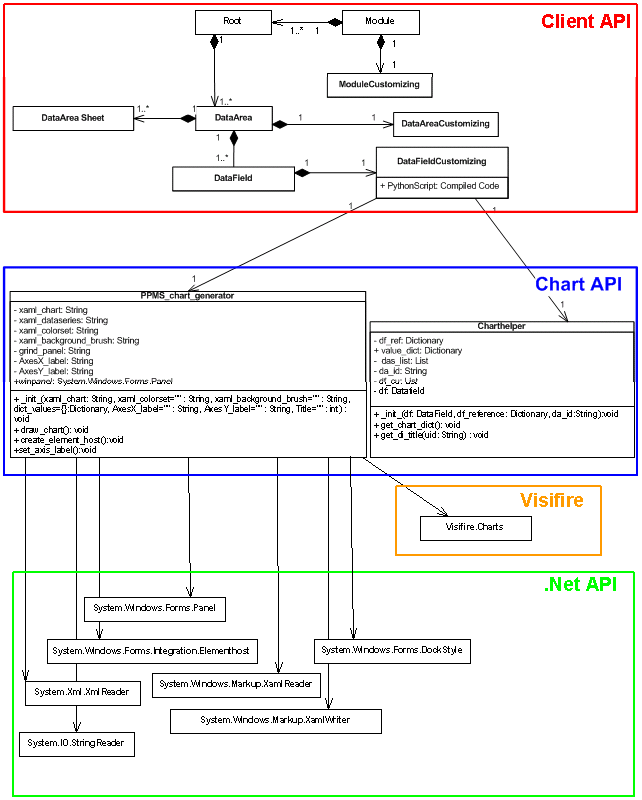
 UML-Diagramm aller verwendeten Klassen:
Public Python Charting-API Reference
Charthelper (charthelper.py)
The Charthelper-class provides methods to prepare raw data for usage within charts. Depending on the specified chart-parameters, values are convertet to be suitable for the Visifire-API.| Member | Type | Comment | |
|---|---|---|---|
| df | DataField | The DataField -Object containing the current Python-Script | |
| df_reference | Dictionary | The Dictionary matching the Chart-Parameters with their DataField -equivalents | |
| da_id | String | The DataArea where raw data is obtained from | |
| Method | Parameters | Return value | Comment |
| Charthelper(df: DataField , df_reference: Dictionary, da_id: DataArea ) | df, DataField The DataField -Object containing the current Python-Script df_reference, Dictionary da_id, String |
see comment | Initializes the Charthelper-Instance with default values and then calls get_chart_dict(). |
| get_chart_dict() | none | Writes processed values into value_dict | Prepares the given raw data for use with PPMS_chart_generator. The processing applied to the data depends on the parameters found in df_reference |
| get_di_title(Uid: String) | Uid, String Uid of the desired DataField |
Returns a String containing the title of the DataField with the specified UID. | |
PPMS_chart_generator (chart_generator.py)
The PPMS_chart_generator-class provides methods for chart-generation with use of custom XAML-formating. Note that generation of charts depends on data that has been processed by an instance of the Charthelper-Class before.| Method | Parameters | Return value | Comment |
|---|---|---|---|
| PPMS_chart_generator(xaml_chart: String, xaml_colorset="": String, xaml_background_brush="": String, dict_values={}: Dictionary, AxesX _label="": String, AxesY _label="":String, Title="": int) | xaml_chart, String XAML-Code used as basic Chart-Template xaml_dataseries, String XAML-Code that detemines the Chart-type (e.g. bars, pie) xaml_colorset, String XAML-Code used for formating of data-series xaml_background_brush, String XAML-Code used for formating of chart background dict_values, Dictionary Contains the prepared data used for chart generation QAxesX_label, String Caption of the X-Axis QAxesY_label, String Caption of the Y-Axis |
After execution, class-member winpanel contains a Chart-Control ready for usage | The produced control can be used within Windows Forms appliances |
| create_element_host() | none | Assigns a new instance of ElementHost (containing generated Chart) to class-member winpanel | To reflect changes of properties, the chart needs to be redrawn via draw_chart() and then embedded into an ElementHost via create_element_host() |
| draw_chart() | none | String containing the XAML-rendering code for current chart. | see also: create_element_host() |
Initialisierung der Charts per Skript
DF-Konfiguration
Information- Die chartspezifischen Parameter werden in einem Konfigurationsfeld im DataFieldCustomizing gespeichert.
- Parameter
- Typ (Pie-, Bar-Chart ...)
- Hintergrundfarbe
- Referenz zu Daten
- ...
- Parameter
- Die Parameter werden zum Instanzieren der Charthelper- und PPMS_chart_generator - Klasse benötigt.
xaml_chart="""<Grid
        xmlns="http://schemas.microsoft.com/winfx/2006/xaml/presentation"
            xmlns:x="http://schemas.microsoft.com/winfx/2006/xaml"
            xmlns:vc="clr-namespace:Visifire.Charts;assembly=WPFVisifire.Charts"
        <x:Name="LayoutRoot">
            <vc:Chart Watermark="False">
                <vc:Chart.Titles>
                    <vc:Title Text="" />
                </vc:Chart.Titles>
                <vc:Chart.AxesX>
                    <vc:Axis Title="" />
                </vc:Chart.AxesX>
                <vc:Chart.AxesY>
                    <vc:Axis Title="" />
                </vc:Chart.AxesY>
            <vc:Chart>
        <Grid>"""

xaml_dataseries="""<UserControl
            xmlns="http://schemas.microsoft.com/winfx/2006/xaml/presentation"
                xmlns:x="http://schemas.microsoft.com/winfx/2006/xaml"
                xmlns:vc="clr-namespace:Visifire.Charts;
                               <assembly=WPFVisifire.Charts">
             <vc:Chart>
                <vc:Chart.Series>
                    vc:DataSeries RenderAs="Pie" MarkerEnabled="True"
                           <MarkerType="Circle" LegendText="">
                </vc:Chart.Series>
            </vc:Chart>
        </UserControl>"""

xaml_colorset=""
xaml_background_brush=""
"""Define Chart - Properties"""
da_id='42162'
#Set datafield_id for chart_values
df_reference={}
df_reference["AxisXLabel"]="134082"
df_reference["LegendText"]=""
df_reference["XValue"]=""
df_reference["YValue"]="142717"
df_reference["ZValue"]=""
df_reference["AxisYLabel"]= df_reference["YValue"]
title=df.Dataarea.Customizing.Name
IronPython-Skript
Informationen- Der Aufruf der Charthelper- und PPMS_chart_generator -Klasse, erfolgt im IronPython-Skriptfeld (siehe DataFieldCustomizing.PythonScript), welches im DataFieldCustomizing gespeichert wird.
- Dieses Skript ist für alle Chartmakros gleich und kann bei Änderung leicht für alle Charts geändert werden.
- Die chartspezifischen Eigenschaften werden aus dem Konfigurationsfeld ausgelesen.
###Automatically generated### ###Changes will be overwritten### from charthelper import Charthelper from chart_generator import PPMS_chart_generator #Execute datafield configuration exec(df.Customizing.PythonScriptSettings) #Get charthelper object ch = Charthelper(df, df_reference, da_id) #Get value dictionary value_dict = ch.value_dict """Create PPMS_chart_generator instance para.1 - xaml_chart, no default value para.2 - xaml_dataseries, no default value para.3 - xaml_colorset, no default value para.4 - xaml_background_brush, no default value para.5 - dict_values: dictionary, default empty dictionary para.6 - AxesX _label: String, default empty para.7 - AxesY _label: String, default empty para.8 - Title: String, default --> AxesX _label + "/" + AxesY _labell """ #Create PPMS Chart chart_panel = PPMS_chart_generator(xaml_chart, xaml_dataseries, xaml_colorset, xaml_background_brush, dict_values=ch.value_dict, AxesX _label=ch.get_di_title(df_reference["AxisXLabel"]), AxesY _label=ch.get_di_title(df_reference["AxisYLabel"]), Title=title) #Get PMS Chart panel ctl = chart_panel.winpanel #Delete datafield variables del xaml_chart del xaml_dataseries del da_id del df_reference del title del ch del value_dict del chart_panel del Charthelper del PPMS_chart_generator del xaml_background_brush del xaml_colorset


| I | Attachment | History | Size | Date | Comment |
|---|---|---|---|---|---|
| |
Chart1.png | r1 | 6.8 K | 2009-09-24 - 13:34 | |
| |
Chart2.png | r1 | 5.8 K | 2009-09-24 - 13:41 | |
| |
Chart3.png | r1 | 3.0 K | 2009-09-24 - 13:44 | |
| |
Chart4.png | r1 | 10.0 K | 2009-09-24 - 13:52 | |
| |
Chart5.png | r2 r1 | 52.5 K | 2009-10-13 - 14:06 | |
| |
Chart6.png | r2 r1 | 4.0 K | 2009-10-13 - 14:10 | |
| |
Chart7.png | r2 r1 | 3.7 K | 2009-10-13 - 14:12 | |
| |
Chart8.png | r2 r1 | 5.4 K | 2009-10-13 - 14:14 | |
| |
Chart9.png | r4 r3 r2 r1 | 39.1 K | 2009-10-13 - 14:16 | |
| |
Charts.doc | r1 | 832.0 K | 2009-10-13 - 11:05 | |
| |
XAMLTemplates.png | r2 r1 | 46.2 K | 2009-10-13 - 11:26 |
|