The documentation from version 39.5.17 of PLANTA project can be found in the new PLANTA Online Help .
.
Customizing of Charts
Information- In PLANTA project, interactive charts can be created, which possess the following advantages compared to Excel charts:.
- Interactivity with PLANTA systems:
- Zooming of charts
- Dynamic display of the chart value over which you moved the mouse as toolbox
- Animation:
- 3D charts
- Display different values per unit
- Set the chart values at running time
- Interactivity with PLANTA systems:
General Procedure
Requirement- In order to use the charts, you have to create a module with a data area which contains the data (e.g. effort or costs) to be visualized.
- This data area is used as source data area for the chart.
- In the data area assignment, the Raw format parameter must be activated.
- This parameter is in window 9 by default and can be displayed by the user.
- The source data area must be visible. I.e. Never display must not be activated. Display = 0 "Do not display" is possible.
Create Chart Data Area
Procedure- Create another data area above the source area:
- Assign the following data item:
- DF = 004336 Button/IronPython
- Set the following parameters:
- DF behavior = py
- DF height: Height of the chart
- DF width: Width of the chart
- Save. Subsequently open the data area anew so the data field becomes visible for entering the script.
Create Chart Script
Procedure- Enter the following code for the chart data field in the IronPython script field:
###Automatically generated###
###Changes will be overwritten###
Charthelper=ConsoleScope['Charthelper']
PPMS_chart_generator=ConsoleScope['PPMS_chart_generator']
#Initialize variables
df_reference={}
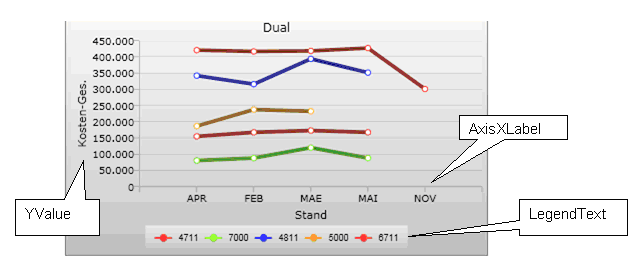
df_reference["AxisXLabel"]=""
df_reference["LegendText"]=""
df_reference["XValue"]=""
df_reference["YValue"]=""
df_reference["ZValue"]=""
df_reference["AxisYLabel"]=""
df_reference["YAxisSuffix"]=""
df_reference["XAxisSuffix"]=""
df_reference["Event"]=""
title=""
da_id=""
xaml_colorset=""
xaml_background_brush=""
xaml_dataseries=""
xaml_chart=""
#Execute datafield configuration
exec(df.Customizing.PythonScriptSettings)
#Get charthelper object
ch = Charthelper(df, df_reference, da_id)
#Get value dictionary
value_dict = ch.value_dict
"""Create PPMS_chart_generator instance
para.1 - xaml_chart, no default value
para.2 - xaml_dataseries, no default value
para.3 - xaml_colorset, no default value
para.4 - xaml_background_brush, no default value
para.5 - dict_values: dictionary, default empty dictionary
para.6 - AxesX _label: String, default empty
para.7 - AxesY _label: String, default empty
para.8 - Title: String, default --> AxesX _label + "/" + AxesY _labell """
#Create PPMS Chart
chart_panel = PPMS_chart_generator(xaml_chart, xaml_dataseries, xaml_colorset, xaml_background_brush, dict_values=ch.value_dict, AxesX _label=ch.get_di_title(df_reference["AxisXLabel"]), AxesY _label=ch.get_di_title(df_reference["AxisYLabel"]), Title=title, modlayout=moduleLayout, dict_event=ch.event_dict, suffix_dict=ch.suffix)
#Get PMS Chart panel
ctl = chart_panel.winpanelSet the Script Parameter
Procedure- Copy the following template into the Data field configuration field.
xaml_chart=""""""
xaml_dataseries=""""""
xaml_colorset=""""""
xaml_background_brush=""""""

#Initialize datarea_id and chart_title -variable
da_id=""
title=df.DataArea.Customizing.Name

"""Define Chart - Properties"""

#Set datafield_id for chart_values
df_reference={}
df_reference["AxisXLabel"]=""
df_reference["LegendText"]=""
df_reference["XValue"]=""
df_reference["YValue"]=""
df_reference["ZValue"]=""
df_reference["AxisYLabel"]="" - In doing so, the parameters listed below will be defined. For each chart type, different parameters must be set.
xaml_chart |
Creation of the chart object |
xaml_dataseries |
Template for the creation of data pair objects. Determines the chart type |
xaml_colorset |
Sets the color for a data pair. If nothing is specified, a default value will be used. |
xaml_background_brush |
Sets the background color. If nothing is specified, a default value will be used. |
verbatim>da_id: |
Specification of the data area from which the data is taken. The data area ID must be specified with leading zero. |
title: |
Specification of the chart title. |
df_reference: |
Each chart parameter is referenced by specifying the DF ID with a PLANTA data field from the source area. |
- In the Iron Python charts module, sample charts for the different chart types are displayed. With CTRL + F3 on the X above the charts, you can switch to the associated data area.
Set the XAML Parameter
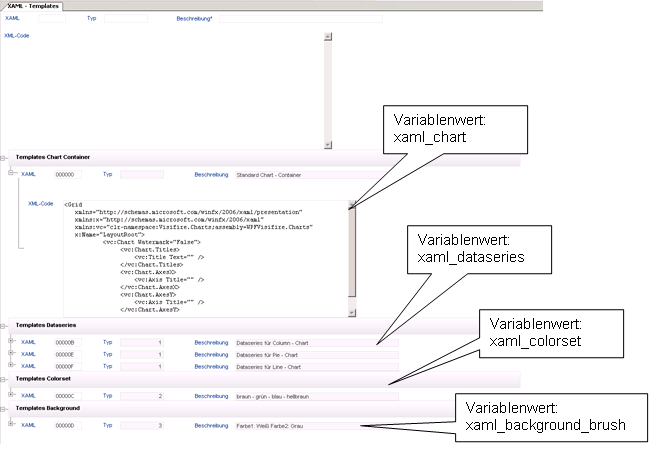
Procedure- Open Customizer Master Data XAML Templates.
- Here, the corresponding XAMLs for the XAML variables xaml_chart, xaml_dataseries, xaml_colorset and xaml_background_brush can be selected in the XML code data field.
- Copy the corresponding XAML code and insert it at the corresponding position in the script in the Data field configuration data field.
- Save.
Set the da_id and title Parameters
Procedure- Set the parameters as follows:
Set the df_reference
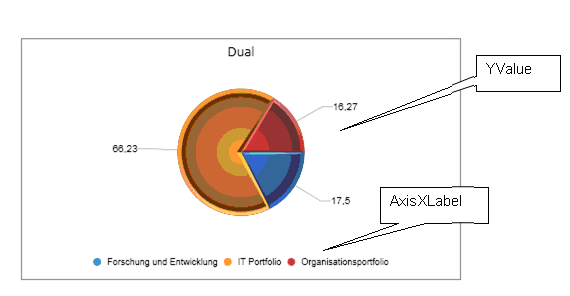
Pie Chart
Procedure- Set the parameters as follows:
#Set datafield_id for chart_values
df_reference["AxisXLabel"]= Specification of the field number for setting the label
df_reference["LegendText"]=""
df_reference["XValue"]=""
df_reference["YValue"]= Specification of the field number for setting the values
df_reference["ZValue"]=""
df_reference["AxisYLabel"]=""
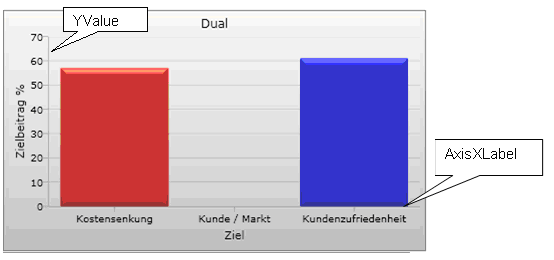
Column Chart
Procedure- Set the parameters as follows:
#Set datafield_id for chart_values
df_reference["AxisXLabel"]= Specification of the field number for setting the X axis label
df_reference["LegendText"]=""
df_reference["XValue"]=""
df_reference["YValue"]= Specification of the field number for setting the Y values
df_reference["ZValue"]=""
df_reference["AxisYLabel"]=df_reference["YValue"]
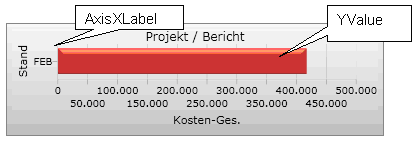
Gantt Chart
Procedure- Set the parameters as follows:
#Set datafield_id for chart_values
df_reference["AxisXLabel"]= Specification for setting the unit label
df_reference["LegendText"]=""
df_reference["XValue"]=""
df_reference["YValue"]= Specification for setting the bar value
df_reference["ZValue"]=""
df_reference["AxisYLabel"]=df_reference["YValue"]
Line Chart
Procedure- Set the parameters as follows:
#Set datafield_id for chart_values
df_reference["AxisXLabel"]= Specification for setting the unit label
df_reference["LegendText"]= Specification of the field number for setting legend labels
df_reference["XValue"]=""
df_reference["YValue"]= Specification for setting the bar value
df_reference["ZValue"]=""
df_reference["AxisYLabel"]=df_reference["YValue"]
Module Start
Procedure- After you have set all parameters:
- Save.
- Start the module.
Charts for Milestone Trend Analysis (MTA)
Introduction
Information- With the help of the milestone trend analysis (MTA), the milestone date estimation of project tasks can be displayed as a diagram or as a chart.
- The display of a milestone trend analysis is realized via module customizing and can be reproduced with the following descriptions.
- For the display of the charts, the Visifire chart component is resorted to.
- The logic for displaying MTA charts is implemented in an IronPython module.
- The MTA module can be activated via an IronPython macro.
Display a List of Task Series with a Milestone Trend Analysis
Procedure- Create a module.
- Create the required data areas and data fields.
- Data areas from data table 354 (Dummy)
- Data areas from data table 824 (task) with the following data fields
- 008445 Task ID
- 008636 Task name
- 008642: Milestone
- 008805 Status from
- 008625 Calc. end
- Subordinate the data area from data table 824 to the Dummy data area.
- Insert the following IronPython script in the IronPython script data field of the placeholder:
import clr
import sys

# Debug: results in reloaded module to reflect code changes in MilestoneChart
# sys.modules.Remove("MTA")
# sys.modules.Remove("MTA.milestone_chart")

from System import DateTime
from System.Windows.Forms import *
from System.Windows.Media import Brushes

from MTA.milestone_chart import milestone_chart
from MTA.milestone_dataseries import milestone_dataseries
from MTA.time_interval_enum import time_interval_enum


# Used global variables from DataField-Configurations
# - targetDataAreaId
# - processIdField
# - processCaptionField
# - reportDateField
# - targetDateField
# - milestoneField
# - milestoneFilter
# - chartTitleField
# report date = report date
# target date = milestone date
exec(df.Customizing.PythonScriptSettings)

# Get DataAreaRecords
targetDataArea=targetDataAreaId
records=[]
roots=list(df.Module.Roots)
for root in roots:
    dataAreas=list(root.DAManager)
    for dataAreaRecord in dataAreas:
        if dataAreaRecord.Customizing.Uid == targetDataArea:
            records.append(dataAreaRecord)

seriesList = {}
fields = {}

# Get field associations from data field configuration
fields["ProcessID"] = processIdField
fields["ProcessCaption"] = processCaptionField
fields["Milestone"] = milestoneField
fields["ReportDate"] = reportDateField
fields["TargetDate"] = targetDateField
fields["ChartTitle"] = chartTitleField

# Initialize milestone value filter
criterias = {}
criterias["Milestone"]=[milestoneFilter]

# Extract needed field-values from records
for record in records:
    values = {}
    areaCU = record.Customizing
    for key in fields.keys():
        fieldCU = areaCU.ChildrenDFC.TryGetValue(fields[key])[1]
        field = record.ChildrenDF.__getitem__(fieldCU)
        value = field.GetValue[str]()
        values[key] = value

    # Filter by milestone value
    if values["Milestone"] in criterias["Milestone"]:
        if values["ReportDate"] != None and values["TargetDate"] != None:
            if values["ProcessID"] not in seriesList.keys():
                seriesList[values["ProcessID"]] = milestone_dataseries()
            # Create Series from values
            series = seriesList[values["ProcessID"]]
            reportDate = DateTime.Parse(values["ReportDate"])
            targetDate = DateTime.Parse(values["TargetDate"])
            series.data_points.Add(reportDate, targetDate)
            if values["ProcessCaption"] != None and values["ProcessCaption"] != "":
                series.title = values["ProcessCaption"]

# Create Chart
chart = milestone_chart(seriesList.values())

#If necessary, define custom time interval here:
#chart.current_time_interval = time_interval_enum.quarters

# Set Chart title from specified DataField
chart.chart_title=df.DataArea.Customizing.ChildrenDFC.TryGetValue(chartTitleField)[1].Title

# Finally render chart do client-control
ctl = chart.get_element_host()- Save.
Modifications to the IronPython Script
- Configuration of the IronPython Script
- In the script, a list of variable names, to which appropriate field numbers must be assigned, can be looked at („targetDataArea", „reportDateField" etc.).
- Such configuration variables must be set in accordance with the following scheme: Variable = "<Value>" in the data field configuration of the placeholder data field.
Information on the Milestone Trend Analysis
- The legend entries in the chart are taken from the Task name field.
- In the tooltips of the individual data items, report date (Status from) and milestone date (Calc. end) are displayed for each task name.
- The time interval of the axis label and the chart grid is defined dynamically depending on the chart measurement/zoom level and the data amount.
Technical Information on the API of the Milestone Trend Analysis
MTA-API Reference (IronPython)
Class milestone_chart
| Member | Type | Comment | |
|---|---|---|---|
time_interval |
Enum of type time_interval_enum |
Sets the time interval for label distance and chart grid. This property is set to _time_interval_enum.automatic by default, but can be overvritten with any value of the specified enumeration. In case of time_interval_enum.automatic, the time interval is dynamically choosen according to chart dimensions and data. |
|
current_data_series |
List of chart data series. Data series must be provided as instances of type milestone_dataseries. |
If chart rendering is started without this property set up, an exception will be thrown. | |
chart_title |
Specifies the string used as chart title | If no chart title is set up, a hard coded, unlocalized string will be used: "Milestone-Trend Analysis" | |
| Method | Parameters | Return value | Comment |
|---|---|---|---|
milestone_chart (dataSeries) (constructor) |
Optional: List of chart data series. Data series must be provided as instances of type milestone_dataseries. |
Returns a new instance of milestone_chart | If source data is not specified in the constructor parameter, it has to be assigned to the current_data_series property later. |
get_element_host() |
none |
Returns the configured chart object wrapped up in an instance of ElementHost | ElementHost is a wrapper-class that enables the use of WPF-Controls inside WinForms-Applications. As the supplied chart is such a WPF-Control, the call of this method is a needed when using the chart in combination with WinForms. |
get_chart_grid() |
none | Returns the configured chart object wrapped up in an instance of Grid (a WPF-UI-Control) | When using the chart within a WPF-Form, this method can be called instead of using the wrapper method get_element_host(). As the chart is native WPF-Control there is no need for a wrapper-control in case of WPF-Appliances. |
Class milestone_dataseries
| Member | Type | Comment | |
|---|---|---|---|
| data_points | A dictionary containing the DateTime-Pairs representing the source data for the milestone chart. Both X (report date) and Y (estimated finish date) milestone values have to be assigned as DateTime-objects. |
In order to use the data series with milestone_chart, at least the DataPoints property has to be set up after creating the instance. | |
| title | Optional. Specifiy a fixed caption for this data series. | By default, series title is optained from source data (DataField 08636, Process Caption) | |
| color | Optional. Specifiy a fixed color for all data points of this series. | By default, color of data points is choosen automatically for each series. | |
| Method | Parameters | Return value | Comment |
|---|---|---|---|
milestone_dataseries() |
none | Returns a new instance of milestone_dataseries | In order to use the data series with milestone_chart, at least the data_points property has to be set up after creating the instance. See property data_points for further information. |
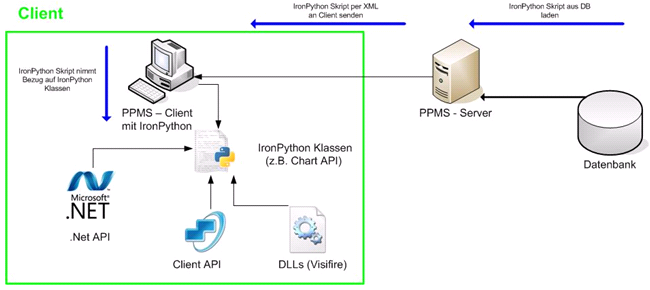
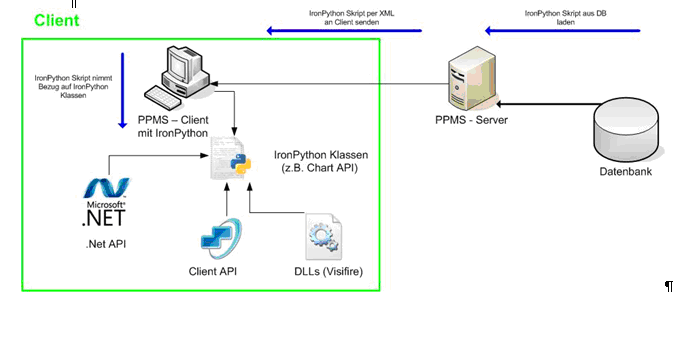
Technical Information for Charts Embedding
Information- For initialization of the visifire charts, you have to create an IronPython class (PPMS_chart_generator) that assumes the drawing of the charts first.
- In order to draw the charts, the .Net API as well as the Visifire DLLs are accessed.
- Another IronPython class (chart helper) takes care of the data preparation. It uses the PLANTA client API.
- Both classes are outsourced to the client directory, so it can be used via the IronPython interface of the PLANTA Client.
- The defined classes are accessed via the PLANTA software. Here, a Python script for initializing the charts is sent from server to client. This is done in a module containing the script as well as all other data.
Create Chart Design
The chart design is described via XAML which is used for creating WPF based surfaces. Example:<Grid
xmlns="http://schemas.microsoft.com/winfx/2006/xaml/presentation"
xmlns:x="http://schemas.microsoft.com/winfx/2006/xaml"
xmlns:vc="clr-namespace:Visifire.Charts;assembly=WPFVisifire.Charts"
x:Name="LayoutRoot"
<vc:Chart Watermark="False"> </Grid>Implementation of IronPython Classes
Carrying out IronPython Scripts on the Client- For the display of charts in the program, scripts can be deposited in the DataFieldCustomizing of data fields.
- All data is accessed via the data field object that contains the script.
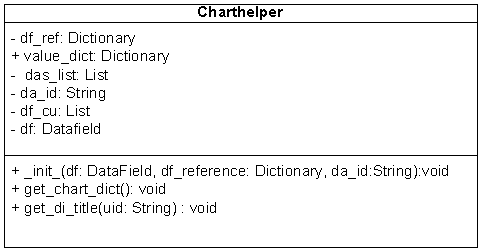
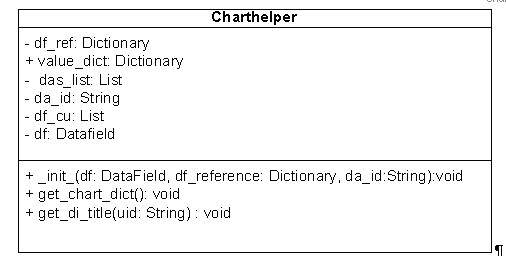
 Class: Chart helper
 - Todo item: Processing of the data
- Storage location Client directory
- Details:
- Name: charthelper
- Attributes
- df: Type DataField - no default value
- Object of the DataField class that contains the chart script.
- df_reference: Type Dictionary (Python Hash-Table) - no default value
- Each chart parameter is connected to a data field.
- da_id: Type string - optional
- Specification of the data area from which the data is taken.
- The data area that contains the chart is referenced by default.
- df: Type DataField - no default value
- Methods:
-
__init__(): Constructor- Sets the attributes and starts the
get_chart_dict()method.
- Sets the attributes and starts the
-
get_chart_dict: void- Carries out the data processing based on the parameters that were defined in
df_reference.- Returns the processed data as dictionary(hash table),
- which can be forwarded to the
PPMS_Chart_generatorclass.
- which can be forwarded to the
- Returns the processed data as dictionary(hash table),
- Carries out the data processing based on the parameters that were defined in
-
get_di_title: String- Parameters: UID of a data field
- Return: Returns the data field title
-
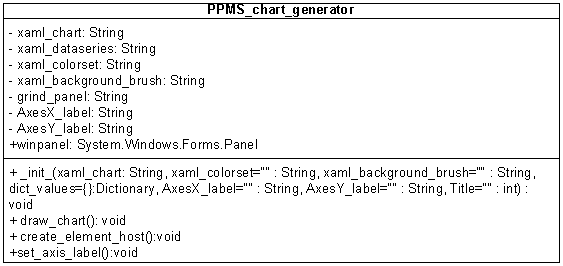
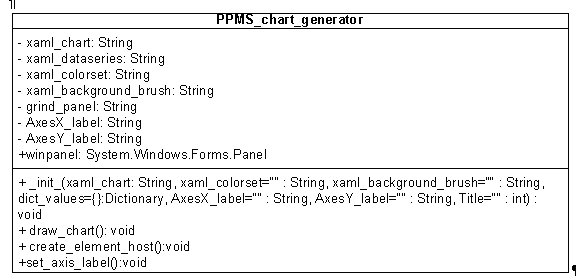
 Class: PPMS_chart_generator
 - Creation of the PPMS_chart_generator class with IronPython for generating the charts on the basis of the processed data from the chart helper class.
- The PPMS_chart_generator class is outsourced to the client directory.
- Details:
- Class name:
PPMS_chart_generator - Constructor parameter:
-
xaml_chart: Type string (XML) - Create a chart object.
- No default value.
-
-
xaml_dataseries: Type string (XML)- Template for the creation of the data pair objects.
- Defines the chart type
- The respective data are set in the constructor.
- No default value.
- Template for the creation of the data pair objects.
-
xaml_colorset: Type string (XML)- Sets the color for a data pair.
- If nothing is specified, a default value is used.
-
xaml_background_brush: Type string (XML)- Setting the background color with color gradients.
- If nothing is specified, a default value is used.
-
dict_values: Type dictionary (hash table)- Processed data dictionary of the chart helper() class
- QAxesX_label: Type string
- Label for x-axis.
- QAxesY_label: Type string
- Label for y-axis.
- Title: Type string
- Chart title
- Class name:
- Methods:
-
__init__(): Constructor- Sets the attributes and starts the chart creation.
-
create_element_host():- Sets the WPF chart into an element host.
- Element host: Links WPF controls with Windows.Forms.Controls.
- Is required since the client is based on the Windows.Forms library.
- Element host: Links WPF controls with Windows.Forms.Controls.
- Sets the WPF chart into an element host.
-
set_values():- Adds the data pairs of the data series.
- Values are added to the chart.
- Adds the data pairs of the data series.
-
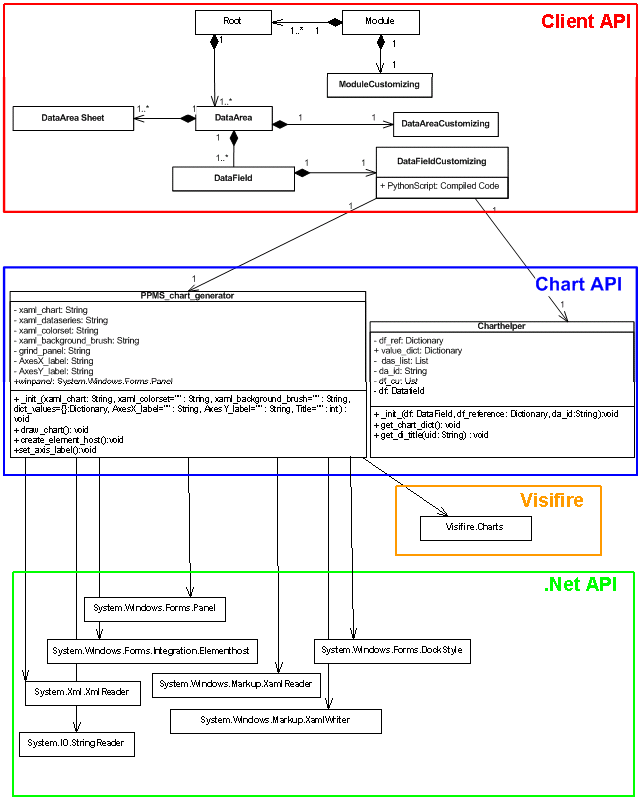
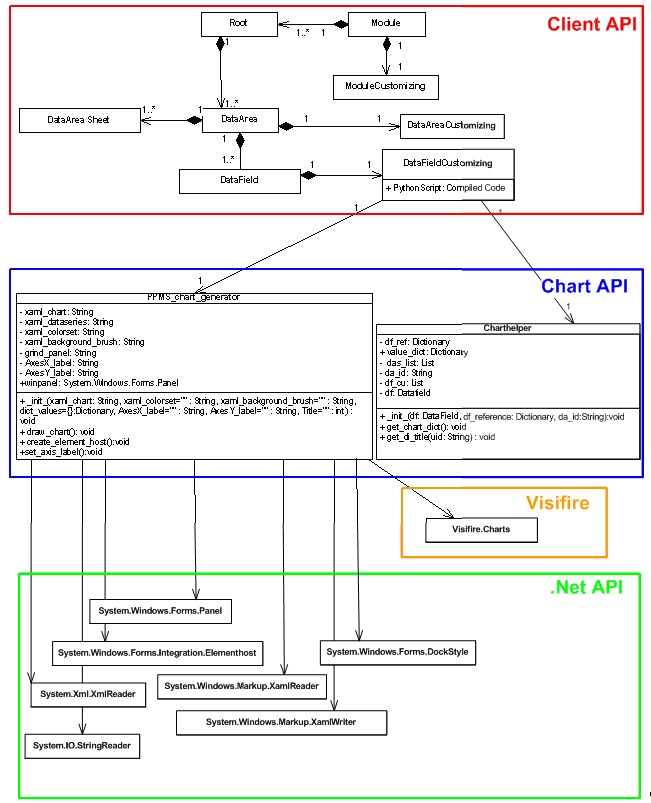
- Used classes from the .Net API:
- System.IO.!QStringReader
- System.Xml.!XmlReader
- System.Windows.Markup.!QXamlReader
- System.Windows.Markup.!QXamlWriter
- System.Windows.Forms.Integration.!QElementHost
- System.Windows.Forms.Panel
- System.Windows.Forms.!QDockStyle
- Used classes from the Visifire API:
- Visifire.Charts
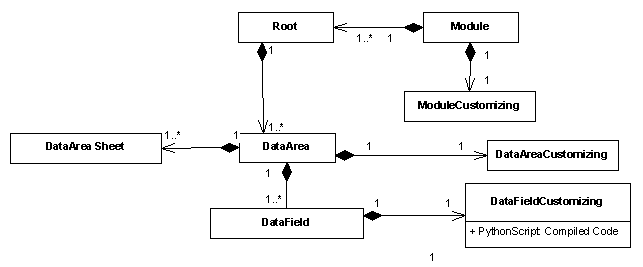
 UML diagram of all used classes:
Public Python Charting API Reference
Charthelper (charthelper.py)
The charthelper class provides methods to prepare raw data for usage within charts. Depending on the specified chart-parameters, values are converted to be suitable for the Visifire-API.| Member | Type | Comment | |
|---|---|---|---|
| df | DataField | The DataField -Object containing the current Python-Script | |
| df_reference | Dictionary | Dictionary matching the Chart-Parameters with their DataField -equivalents | |
| da_id | String | The DataArea where raw data is obtained from | |
| Method | Parameters | Return value | Comment |
| Charthelper(df: DataField , df_reference: Dictionary, da_id: DataArea ) | df, DataField The DataField -Object containing the current Python-Script df_reference, Dictionary da_id, String |
see comment | Initializes the Charthelper-Instance with default values and then calls get_chart_dict(). |
| get_chart_dict() | none | Writes processed values into value_dict | Prepares the given raw data for use with PPMS_chart_generator. The processing applied to the data depends on the parameters found in df_reference |
| get_di_title(Uid: String) | Uid, String Uid of the desired DataField |
Returns a String containing the title of the DataField with the specified UID. | |
PPMS_chart_generator (chart_generator.py)
The PPMS_chart_generator class provides methods for chart-generation with use of custom XAML-formating. Note that generation of charts depends on data that has been processed by an instance of the charthelper class before.| Method | Parameters | Return value | Comment |
|---|---|---|---|
| PPMS_chart_generator(xaml_chart: String, xaml_colorset="": String, xaml_background_brush="": String, dict_values={}: Dictionary, AxesX _label="": String, AxesY _label="":String, Title="": int) | xaml_chart, String XAML-Code used as basic Chart-Template xaml_dataseries, String XAML-Code that detemines the Chart-type (e.g. bars, pie) xaml_colorset, String XAML-Code used for formating of data-series xaml_background_brush, String XAML-Code used for formating of chart background dict_values, Dictionary Contains the prepared data used for chart generation QAxesX_label, String Caption of the X-Axis QAxesY_label, String Caption of the Y-Axis |
After execution, class-member winpanel contains a Chart-Control ready for usage | The produced control can be used within Windows Forms appliances |
| create_element_host() | none | Assigns a new instance of ElementHost (containing generated Chart) to class-member winpanel | To reflect changes of properties, the chart needs to be redrawn via draw_chart() and then embedded into an ElementHost via create_element_host() |
| draw_chart() | none | String containing the XAML-rendering code for current chart. | see also: create_element_host() |
Initialization of the Charts per Script
DF Configuration
Information- The chart specific parameters are saved in a configuration field in the DataFieldCustomizing.
- Parameters
- Type (Pie, Gantt chart ...)
- Background color
- Reference to data
- ...
- Parameters
- The parameters are necessary for instancing the chart helper and PPMS_chart_generator class.
xaml_chart="""<Grid
        xmlns="http://schemas.microsoft.com/winfx/2006/xaml/presentation"
            xmlns:x="http://schemas.microsoft.com/winfx/2006/xaml"
            xmlns:vc="clr-namespace:Visifire.Charts;assembly=WPFVisifire.Charts"
        <x:Name="LayoutRoot">
            <vc:Chart Watermark="False">
                <vc:Chart.Titles>
                    <vc:Title Text="" />
                </vc:Chart.Titles>
                <vc:Chart.AxesX>
                    <vc:Axis Title="" />
                </vc:Chart.AxesX>
                <vc:Chart.AxesY>
                    <vc:Axis Title="" />
                </vc:Chart.AxesY>
            <vc:Chart>
        <Grid>"""

xaml_dataseries="""<UserControl
            xmlns="http://schemas.microsoft.com/winfx/2006/xaml/presentation"
                xmlns:x="http://schemas.microsoft.com/winfx/2006/xaml"
                xmlns:vc="clr-namespace:Visifire.Charts;
                               <assembly=WPFVisifire.Charts">
             <vc:Chart>
                <vc:Chart.Series>
                    vc:DataSeries RenderAs="Pie" MarkerEnabled="True"
                           <MarkerType="Circle" LegendText="">
                </vc:Chart.Series>
            </vc:Chart>
        </UserControl>"""

xaml_colorset=""
xaml_background_brush=""
"""Define Chart - Properties"""
da_id='42162'
#Set datafield_id for chart_values
df_reference={}
df_reference["AxisXLabel"]="134082"
df_reference["LegendText"]=""
df_reference["XValue"]=""
df_reference["YValue"]="142717"
df_reference["ZValue"]=""
df_reference["AxisYLabel"]= df_reference["YValue"]
title=df.Dataarea.Customizing.Name
IronPython Script
Information- The chart helper and PPMS _chart_generator class is opened in the IronPython script field (see DataFieldCustomizing.PythonScript), which is saved in the DataFieldCustomizing.
- This script is the same for all chart macros and can be changed easily for all charts upon changes.
- The chart specific settings are read out from the configuration field.
###Automatically generated###
###Changes will be overwritten###
from charthelper import Charthelper
from chart_generator import PPMS_chart_generator
#Execute datafield configuration
exec(df.Customizing.PythonScriptSettings)
#Get charthelper object
ch = Charthelper(df, df_reference, da_id)
#Get value dictionary
value_dict = ch.value_dict
"""Create PPMS_chart_generator instance
para.1 - xaml_chart, no default value
para.2 - xaml_dataseries, no default value
para.3 - xaml_colorset, no default value
para.4 - xaml_background_brush, no default value
para.5 - dict_values: dictionary, default empty dictionary
para.6 - AxesX _label: String, default empty
para.7 - AxesY _label: String, default empty
para.8 - Title: String, default --> AxesX _label + "/" + AxesY _labell """
#Create PPMS Chart
chart_panel = PPMS_chart_generator(xaml_chart, xaml_dataseries, xaml_colorset, xaml_background_brush, dict_values=ch.value_dict, AxesX _label=ch.get_di_title(df_reference["AxisXLabel"]), AxesY _label=ch.get_di_title(df_reference["AxisYLabel"]), Title=title)
#Get PMS Chart panel
ctl = chart_panel.winpanel
#Delete datafield variables
del xaml_chart
del xaml_dataseries
del da_id
del df_reference
del title
del ch
del value_dict
del chart_panel
del Charthelper
del PPMS_chart_generator
del xaml_background_brush
del xaml_colorset


| I | Attachment | History | Size | Date | Comment |
|---|---|---|---|---|---|
| |
Chart1.png | r1 | 6.8 K | 2009-09-24 - 13:34 | |
| |
Chart2.png | r1 | 5.8 K | 2009-09-24 - 13:41 | |
| |
Chart3.png | r1 | 3.0 K | 2009-09-24 - 13:44 | |
| |
Chart4.png | r1 | 10.0 K | 2009-09-24 - 13:52 | |
| |
Chart5.png | r2 r1 | 52.5 K | 2009-10-13 - 14:06 | |
| |
Chart6.png | r2 r1 | 4.0 K | 2009-10-13 - 14:10 | |
| |
Chart7.png | r2 r1 | 3.7 K | 2009-10-13 - 14:12 | |
| |
Chart8.png | r2 r1 | 5.4 K | 2009-10-13 - 14:14 | |
| |
Chart9.png | r4 r3 r2 r1 | 39.1 K | 2009-10-13 - 14:16 | |
| |
Charts.doc | r1 | 832.0 K | 2009-10-13 - 11:05 | |
| |
XAMLTemplates.png | r2 r1 | 46.2 K | 2009-10-13 - 11:26 |
|